Top 7 Data Analytics Tools to Consider in 2025 (and Why Lumenore Stands Out)


In 2025, data analytics will play a pivotal role in how businesses operate and compete. As organizations look to turn vast amounts of data into actionable strategies, the right analytics tool can be a game-changer. Research shows that businesses using predictive analytics have seen up to a 25% boost in customer satisfaction and a 15% improvement in efficiency. But not all tools are created equal. Companies need platforms that are AI-powered, user-friendly, and ready to adapt to rapid technological change.
The popular data analytics tools range from AI-powered analytics platforms to cloud-based options with unique features that make information more readily available, faster, and easier to understand. This section will explore seven leading data analytics tools that are driving the future.
Below is a detailed comparison of the top seven data analytics tools making waves in 2025, starting with one you may not know—but should: Lumenore.
1. Lumenore
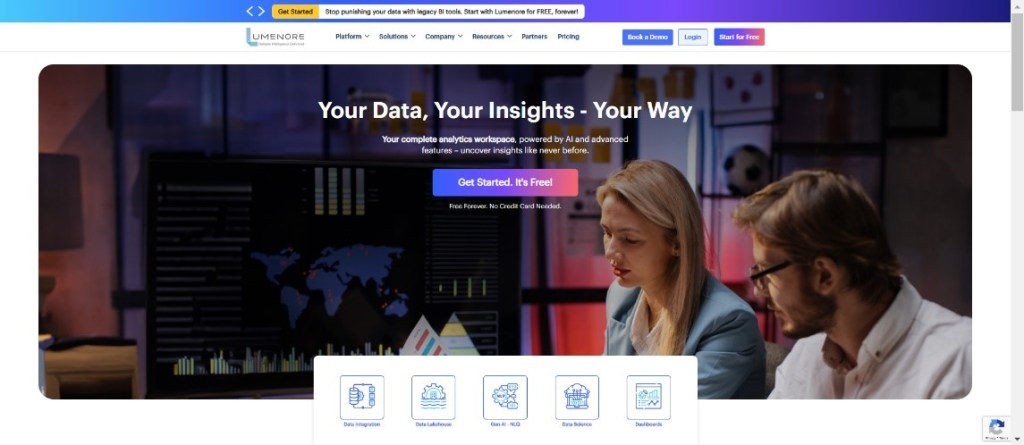
Lumenore is an AI-powered data analytics platform designed to simplify self-service analytics for businesses of all sizes. Its intuitive interface enables users—regardless of technical expertise—to gain actionable insights through natural language queries.
Key Features of Lumenore:
- Conversational Analytics: Users can ask questions in natural language and receive insights instantly. For example, queries like “What was the production output last Thursday?” or “Show current scrap rates by product line” make analytics accessible even to those without technical expertise.
- Interactive Data Visualization and Dashboards: Lumenore offers various customizable widgets such as graphs, charts, tables, and heat maps. Users can design dashboards that best represent their data—whether it’s bar charts for production figures or line graphs to analyze trends. Clear layout, consistent color codes, and prominently visible KPIs ensure usability and clarity.
- Advanced Analytics: The “Do You Know” module uses ML-powered algorithms to identify patterns and trends. It helps provide predictive insights to improve efficiency and reduce costs. The other types of advanced analytics offered by Lumenore include:
- Pattern Recognition: Automatically detects recurring trends in datasets, allowing businesses to anticipate changes or opportunities.
- Predictive Analytics: Forecasts demand, identifies potential equipment failures, and proactively predicts quality-related issues to mitigate risks.
- What-If Analysis: Facilitates faster decision-making by embedding tailored analytics into workflows and business apps.
- Data Transformation and Connectivity: Simplifies data collection and transformation by connecting to over multiple sources to ensure analytics-ready streams.
- Integration with Other Tools and ETL Capabilities: Lumenore integrates seamlessly with CRMs, ERPs, and productivity apps, creating a unified analytics ecosystem.
Its Data Integration Layer, a UI-based ETL tool, simplifies data workflows with three key functions:
- Data extraction from diverse sources
- Transformation into analytics-ready formats
- Loading into destinations like data lakes or warehouses
The tool offers project and user management, scheduler automation, and workspace organization for streamlined operations. With customizable, real-time tracking of schedules, businesses can access clean, accurate data effortlessly.
Lumenore is best suited for businesses of all sizes, especially those looking to democratize analytics and empower their teams with data-driven decision-making. For instance, the “Ask Me” module works like an intelligent assistant, providing swift answers without navigating complex dashboards or reports. It is an ideal solution for organizations that value operational efficiency and need intuitive tools to make sense of their data without relying on technical expertise. Additionally, small and medium-sized businesses (SMBs) can benefit from its cost-effective, scalable platform, leveraging its predictive insights to optimize operations and prevent potential issues.
2. Tableau

Tableau (First released in 2003 and acquired by Salesforce in 2019) is a leading data visualization and business intelligence tool designed to transform raw data into actionable insights through interactive dashboards and reports. It is among the most widely used tools for data visualization.
Key Features of Tableau:
- Connectivity with Live and In-Memory Data: Tableau offers robust data connection options, supporting both live data streams and in-memory extracts. Users can access real-time data directly from sources or work offline with extracted data. Additional features, such as automated refreshes and notifications for connection failures, ensure reliability and flexibility.
- Mobile-Friendly Dashboards: Tailored for mobile use, Tableau allows users to design responsive dashboards optimized for smartphones and tablets, offering flexibility and real-time insights on the go.
- Comprehensive Map Data: With pre-installed geographic data, Tableau enables the creation of detailed and interactive maps, such as heat maps and point distribution maps, making location-based analytics straightforward.
Tableau is extremely popular with enterprises, SMBs, data analysts, and finance, healthcare, retail, and technology businesses. It connects to a wide range of data sources, including spreadsheets, relational and non-relational databases, cloud data platforms, and big data warehouses. Compatible with tools like Google Analytics, Salesforce, and Hadoop, Tableau empowers users to effortlessly blend data from multiple sources into cohesive visualizations.
Tableau’s intuitive drag-and-drop interface and wide-ranging visualization capabilities make it a standout platform. Features like the “Ask Data” tool for natural language queries and predictive analytics simplify complex data analysis, catering to both technical and non-technical users. Tableau’s visualization library includes everything from basic bar and pie charts to advanced options like heat maps, Gantt charts, and motion graphs. Users can easily create complex, dynamic visuals, selecting from an extensive range of templates via the “Show Me” menu.
3. Microsoft Power BI

Power BI (Launched in July 2015 by Microsoft) is a robust business intelligence tool that allows users to connect various data sources, examine data, and share information across an entire organization. Power BI is interconnected with other Microsoft products, making it an ideal option for companies using Office 365 or other Microsoft tools.
Key Features of Power BI:
- Monthly Product Updates: Stay ahead with regular feature updates influenced by a dynamic user community that caters to real-world needs.
- Scalability for Large Datasets: Power BI compresses and analyzes massive datasets, even those exceeding 100 million rows, and offers faster query times options through Power BI Premium.
- Custom Visualizations: Leverage R and Python libraries to create bespoke visuals tailored to specific data storytelling needs.
- Excel Integration: Analyze Power BI datasets directly within Excel, combining familiar tools like PivotTables with the power of connected reporting.
Power BI is ideal for organizations who are already part of Microsoft’s ecosystem. It is particularly beneficial for enterprises and SMBs that require an affordable, flexible, and scalable solution for business data analysis and intelligence.
4. Looker

Looker (Founded in 2012 and acquired by Google in 2019) is designed to help companies that require extensive, real-time data analysis. The platform allows companies to examine data in a completely customizable manner, and it is integrated directly into the user workflow so that data insights are quickly available.
Key Features of Looker:
- Custom Applications: Users can develop tailored visualization experiences to meet specific organizational needs, ensuring a personalized analytics experience.
- Advanced Integrations: The platform can seamlessly connect with platforms like Google BigQuery, Snowflake, AWS Redshift, and 50+ SQL dialects for comprehensive data handling.
- LookML Programming: Users can explore LookML to simplify data modeling to define dimensions, measures, and relationships in SQL databases.
- Cloud Hosting Options: It ensures scalability and reliability with hosting on platforms such as Google Cloud Platform and AWS.
Looker is perfect for data-driven enterprises, startups, and industries like technology, e-commerce, and finance, particularly those needing customizable visuals, collaborative dashboards, and a unified source of truth.
Looker’s standout feature is its LookML programming language which simplifies complex data modeling while offering advanced integrations with diverse SQL dialects. This flexibility empowers organizations to create highly customized and actionable visualizations.
5. Qlik Sense

Qlik Sense (Launched in 2014) is a modern data analytics platform to explore dynamic data and make insightful decisions. With its powerful associative data model and advanced analytics capabilities, Qlik Sense is a game-changer in the BI space.
Key Features of Qlik Sense:
- Associative Data Modeling: Qlik Sense’s hallmark is its associative data model by which you can explore data dynamically without predefined hierarchies. This feature allows intuitive navigation through datasets to help you uncover hidden relationships and insights.
- QIX Engine: At its core, Qlik Sense boasts a high-speed, in-memory QIX Engine for rapid data discovery and analysis. The QIX Engine delivers lightning-fast performance with advanced indexing techniques, even for massive datasets.
- Insight Advisor: This AI-powered assistant provides personalized recommendations to bring context-aware insights and visualizations to the table. By analyzing data patterns, the Insight Advisor helps users uncover trends and make better-informed decisions.
- Centralized Collaboration: Qlik Sense fosters teamwork by enabling centralized sharing and collaboration through its cloud or on-premises environments. Teams can collaborate on data visualizations and share insights in real-time, enhancing decision-making processes.
Qlik Sense is particularly beneficial for organizations dealing with large datasets and complex data structures, allowing teams to uncover hidden insights and make data-driven decisions. Qlik Sense is suitable for retail, healthcare, finance, and manufacturing industries, where data exploration and real-time decision-making are essential.
Qlik Sense’s main USP is its Associative Data Model. Unlike traditional BI tools, Qlik Sense enables users to explore data freely without being limited by predefined hierarchies. Additionally, the QIX Engine provides high-speed in-memory processing, ensuring that users can effortlessly analyze large volumes of data.
6. SAS Visual Analytics

SAS Visual Analytics (Launched in 2012) is a unified, in-memory analytics platform designed to help businesses with interactive reporting, visual discovery, self-service analytics, scalability, and governance. The tool claims to offer you observations at a granular level using advanced analytics modeling techniques.
Key Features of SAS Visual Analytics:
- Data Access, Preparation & Quality: Access, profile, cleanse, and transform data through a self-service interface with embedded AI capabilities. SAS ensures superior data quality for precise and actionable insights.
- Text and Location Analytics: Extract insights from text data such as social media to analyze sentiment and trends. Combine location data with traditional sources to contextualize insights geographically.
- Embedded Insights & Integration: Embed visual insights into custom applications or Microsoft 365, fostering collaboration and seamless decision-making. SAS’s open integration allows developers to enhance visualizations with third-party libraries like D3 or leverage REST APIs for custom solutions.
- Cloud Native Architecture & Mobile Apps: Powered by SAS Viya, the cloud-native design optimizes your cloud investments. Native mobile apps ensure on-the-go access to dynamic dashboards and interactive reports.
SAS Visual Analytics is ideal for businesses seeking modern data analytics tools to unearth insights at unprecedented speeds and discover new rooms for growth revenue. Its visual exploration, ad-hoc reporting, and forecasting capabilities fit perfectly for enterprises looking to adapt quickly and improve operational efficiency.
With support for multiple languages, embedded analytics, and robust governance, SAS Visual Analytics combines scalability and agility to unlock your data’s true potential. It is the perfect solution for organizations seeking to make data-driven decisions supported by collaboration and innovation.
7. IBM Watson

IBM Watson (Launched in 2010) is one of the best analytics tools named after IBM’s iconic CEO, Thomas J. Watson. Designed with advanced natural language processing (NLP) capabilities and AI powered analytics, Watson interprets human language, analyzes vast datasets, and delivers actionable insights in seconds. Developed as part of IBM’s DeepQA research project, Watson was initially created to answer complex questions using human-like reasoning.
Key Features of IBM Watson:
- Cloud-Enabled Scalability: Watson operates in a cloud environment, offering flexible, cost-efficient scalability. Businesses can pay as they grow without spending on expensive in-house infrastructure.
- API Integration: Watson’s APIs simplify embedding advanced functionalities like NLP, text analytics, and AI-driven automation into business applications. Developers can seamlessly integrate Watson’s capabilities into existing systems.
- Natural Language Processing & Understanding: Watson’s NLP goes beyond syntax to grasp context, sentiment, and relationships. It is invaluable for tasks like sentiment analysis, automated content generation, and real-time decision support.
- Automated Processes with Watson Orchestrate: Streamline repetitive tasks with Watson Orchestrate, which uses AI-driven automation and robotics process integration to free up time for higher-value activities.
IBM Watson suits businesses in data-intensive industries like healthcare, finance, and retail, where insights from vast, unstructured datasets can have a significant impact.
Unlike traditional analytics platforms, IBM Watson blends AI, cognitive computing, and machine learning to deliver deeper insights and foster innovation. Whether through its intuitive natural language interface or domain-specific solutions, Watson empowers organizations to automate processes, uncover hidden opportunities, and make data-driven decisions faster than ever before.
Summing up
Undoubtedly, data analytics software will continue to open new heights of success for organizations in the upcoming years. In this regard, using the best analytics tools, such as Lumenore, Tableau, Power BI, and Looker, is necessary to make better data-driven decisions.
If you are unsure about harnessing data analytics capabilities, start with free data analytics solutions and slowly move to paid platforms as your requirements increase. Whether you are a small start-up or an enterprise-level company, using the right data analytics tools will enable you to unlock every potential data value.
FAQ
A: Lumenore is a strong Excel alternative, especially for teams seeking automated insights, AI-powered forecasting, and natural language querying without manual formulas.
A: Tools like Lumenore, IBM Watson, and SAS Visual Analytics integrate AI/ML. Lumenore stands out for using AI to answer questions in plain English.
A: Lumenore is ideal for small businesses due to its low learning curve, self-service dashboards, and cost-effective pricing.
A: Yes. Lumenore is designed for non-technical users and supports drag-and-drop dashboards and natural language queries.