
Agentic Manufacturing Analytics
Agentic Manufacturing Analytics for Faster Production, Quality, and Supply Chain Decisions
Downtime, scrap, WIP imbalances, and supplier delays rarely live in one system. The data that explains them is spread across production, quality, inventory, workforce, procurement, and finance systems, often across multiple plants.
Lumenore, an Agentic Analytics Platform, brings that manufacturing context together and uses specialized AI agents to answer business questions, investigate performance changes, apply advanced analysis where appropriate, and surface where attention is needed. Plant teams no longer have to wait for the next reporting cycle to get answers.
Powered by the Lumenore Agentic Analytics Platform
- 1 week → secondsReporting cycle, from up to a week to near real time
- 30%Clearer, more continuous WIP tracking
- Real‑timeTracking of labor, scrap and overhead cost drivers
- SignificantReduction in manual reporting, with self-service access
Customer results from a leading global automotive parts manufacturer using Lumenore. Results are implementation-specific and are not guaranteed outcomes.
Trusted by Manufacturing and Industrial Organizations





Category Definition
What Is Manufacturing Analytics, and What Makes It Agentic?
Manufacturing analytics brings together production, equipment, quality, inventory, supplier, workforce, and financial data to help teams understand performance and make better operational decisions.
Agentic manufacturing analytics takes that experience further, moving past predefined dashboards. Rather than expecting a user to know which report or analytical method to open, Lumenore interprets a business question and routes it to the analytical capability best suited to answer it, whether that means natural language KPI analysis, root cause investigation, forecasting, anomaly analysis, or visualization.
- Monitor predefined KPIs Start with a business question or a performance signal
- Drill through predefined views Investigate the drivers behind a change
- Move between tools for deeper analysis Use specialized analytical agents within one conversational experience
- Ask analysts to build the next report Continue the investigation with focused follow-up questions
- Separate operational and business context Bring production, quality, inventory, supplier, workforce, and cost context together
The Manufacturing Decision Challenge
Manufacturing Doesn’t Have a Data Shortage.
It Has a Decision-Context Problem.
A production loss rarely has one obvious cause. Machine conditions, materials, quality, staffing, inventory, supplier performance, and production schedules can all play a part, while the evidence sits scattered across different systems and different teams.
Production Visibility Arrives Too Late
When production and spend reporting takes hours or days, plant leaders end up reacting after downtime, WIP, or delivery issues have already affected output.
Root Causes Hide Across Systems
A scrap spike or OEE decline can involve machine, material, shift, quality, and process conditions that are hard to investigate from a single place.
Operational and Financial Context Stay Disconnected
Teams need to understand not just what changed on the plant floor, but what that change means for labor, scrap, overhead, margin, and delivery.
Supply Risk Reaches Production Before the Insight Does
Vendor delays, shortages, and inventory imbalances often surface only after they’ve already put the schedule or a customer commitment at risk.
Every Follow-Up Question Creates Another Reporting Queue
When business users depend on analysts for each new slice, comparison, or explanation, investigation can’t keep pace with operations.
Plant Views Don’t Always Roll Up to Enterprise Priorities
Local reports can use different definitions and structures, which makes cross-plant comparison and executive prioritization harder than it needs to be.


The Manufacturing Decision Cycle
One Analytics Layer Across the Manufacturing Decision Cycle.
Lumenore helps manufacturing teams connect the decisions that shape performance from planning through delivery, using a consistent, governed view of the data behind them.
Plan
What should we produce? Align demand, orders, inventory, forecast, and capacity with production requirements.
Produce
Are we producing efficiently? Analyze throughput, cycle time, WIP, utilization, OEE, and performance across plants, lines, and shifts.
Control
Where are quality and cost moving? Connect product, process, material, labor, scrap, and cost context to see where yield or margin is being lost.
Intervene
What needs attention, and why? Investigate bottlenecks, deviations, and contributing factors so teams know where to focus first.
Deliver
Can we meet the customer commitment? Bring supplier, inventory, production, warehouse, and logistics signals together to understand delivery risk.
Scroll the stages, tap a card, or pick a circle
Beyond the Dashboard
Your OEE Dashboard Shows the Drop. What Happens Next?
Dashboards are essential for monitoring known metrics. The harder problem starts when a number changes and the next question was never predefined.
-
OEE
fell yesterday
Now investigate
Lumenore helps you investigate which line, machine, or shift contributed most to the decline.
-
Scrap
increased
Now investigate
Lumenore helps you investigate which product, material, machine, process, or shift conditions are associated with the increase.
-
WIP
above plan
Now investigate
Lumenore helps you investigate where inventory is accumulating and which process stage is creating the imbalance.
-
Supplier performance
declined
Now investigate
Lumenore helps you investigate which vendors or materials are most connected to delivery or cost risk.
-
Unit cost
moved off plan
Now investigate
Lumenore helps you investigate whether the change is linked to labor, scrap, overhead, procurement, productivity, or product mix.
The goal isn’t to replace the dashboard. It’s to make the next analytical step easier, moving from:
- What changed?
- Why?
- Is the pattern continuing?
- Where should we focus?

See an OEE Investigation in Action.
Walk through how a single question about yesterday’s OEE becomes a located, evidenced answer.
The Agentic Experience
One Question. The Right Analytical Agent. One Decision Experience.
Lumenore Ask Me uses a Master Agent to interpret the intent of a query and route it to the most suitable specialized agent. Users can also select an agent directly when they want more control over the analytical path.
As an investigation evolves, focused follow-up questions can move a user from a KPI answer to root cause analysis, advanced analysis, or a clearer visualization, all without starting a separate reporting request.
“Why did OEE fall on Line 4 yesterday?”
The Master Agent routes the question to the appropriate analytical capability, and the RCA Agent investigates the contributing factors.
“Is downtime showing a recurring pattern?”
The Data Science Agent can apply trend, anomaly, or forecasting techniques where the data and question support them.
“Compare the loss by shift.”
The Visualization Agent presents the result in a useful comparative view.
“Show the supporting metrics.”
The experience keeps the answer tied to the governed data and business context available to the user.
One investigation. Not a separate reporting request for every follow-up question.
Meet the Analytical Agents
-
Master Agent
Interprets query intent and routes the request to the most suitable analytical agent.
-
NLQ Agent
Answers KPI, comparison and descriptive questions using natural language.
-
RCA Agent
Investigates contributing factors behind changes in metrics such as OEE, scrap or throughput.
-
Data Science Agent
Applies supported advanced analyses such as forecasting, trends, anomalies, and other data science techniques.
-
Visualization Agent
Creates or refines visual output so plant, line, shift, or machine comparisons are easier to interpret.
More on AI agents for analytics
Decision Journeys
Agentic Analytics for the Manufacturing Decisions That Matter.
Start with the manufacturing question, connect the relevant context, and use the right analytical capability to shorten the path from signal to decision.
-
01
OEE & Downtime Intelligence
Where are we losing availability or performance, and why?
- OEE
- Downtime
- Throughput
- Line & machine
- Shift context
- Root cause
OutcomeFaster diagnosis and production recovery.
-
02
Quality & Scrap Intelligence
What is driving the increase in scrap, defects or rework?
- Product
- Material
- Machine
- Process
- Shift patterns
- Cohort comparison
OutcomeBetter yield, quality consistency and continuous-improvement focus.
-
03
WIP & Inventory Intelligence
Where is WIP accumulating, or where is inventory visibility breaking down?
- Plant
- Process stage
- Inventory
- Imbalance
- Bottlenecks
OutcomeClearer flow visibility and more informed production planning.
-
04
Supplier & Procurement Intelligence
Which vendors or materials are creating the greatest production or cost risk?
- Vendor shipments
- Procurement
- Material availability
- Cost patterns
OutcomeEarlier supply-risk visibility and better sourcing decisions.
-
05
Manufacturing Cost Intelligence
Why are labor, scrap or overhead costs moving off plan?
- Labor
- Scrap
- Overhead
- Procurement
- Product mix
OutcomeFaster cost-driver analysis and margin visibility.
-
06
Executive Manufacturing Intelligence
Where is performance improving, and where is it at risk across plants?
- Cross-plant KPIs
- Operational drivers
- Priority areas
OutcomeFaster enterprise prioritization across sites and lines.

See It in Lumenore
Production, Quality and Supply in One Investigation.

Locate the Loss, Not Just the Number.
Break an OEE decline into availability, performance and quality, then follow it down to the line, machine, shift and downtime reason carrying most of the drop.
- OEE, downtime and throughput across plants, lines and shifts
- Root cause investigation on the metric that moved
- Trend and anomaly analysis where the data supports it
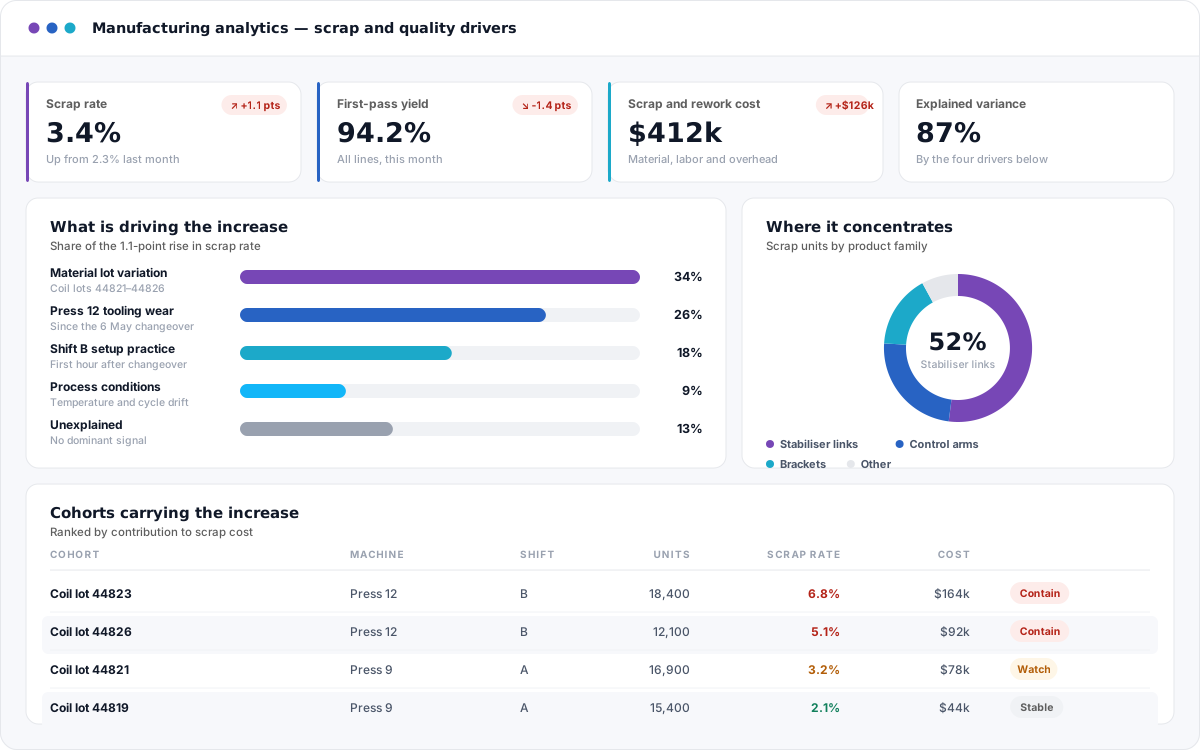
Connect Scrap to the Conditions Behind It.
Compare product, material, machine, process and shift conditions associated with a scrap or defect increase, and see what that yield loss is worth in labor, material and overhead.
- Defect and scrap drivers ranked by contribution
- Cohort comparison across shifts, batches and lines
- Operational change read against its cost impact
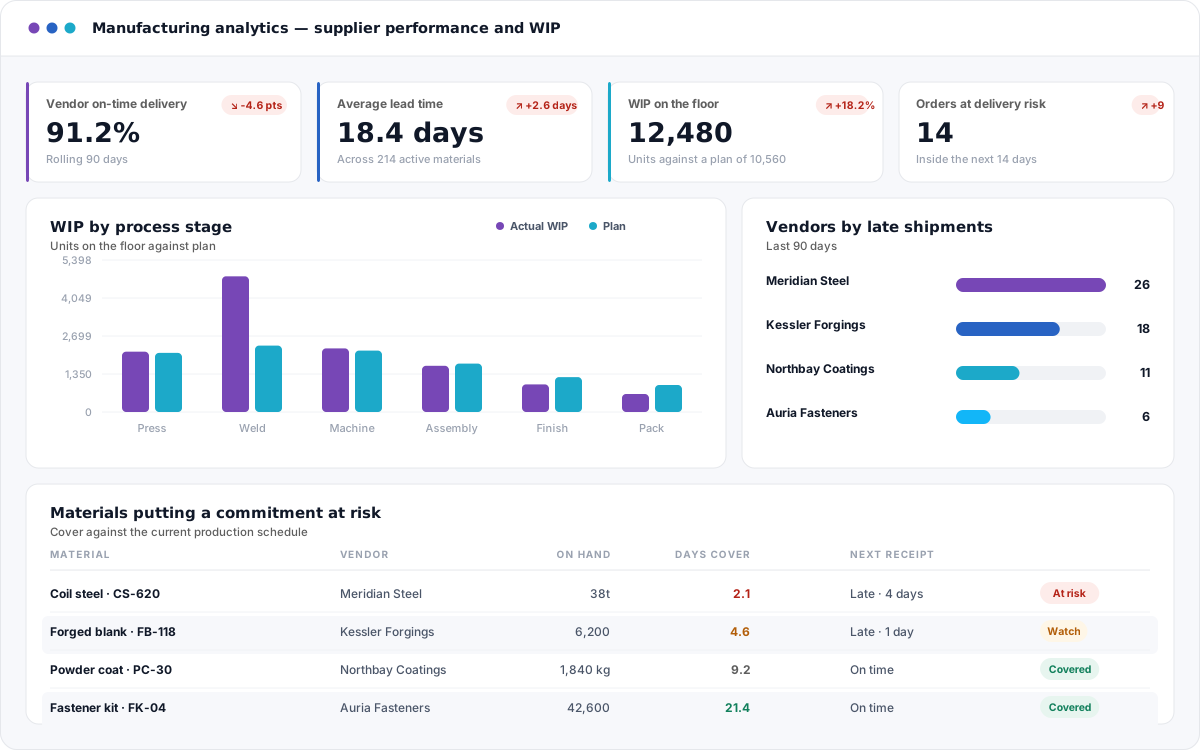
See Supply Risk Before the Schedule Does.
Read vendor shipment performance, material availability, inventory and WIP together, so a supplier slipping shows up while there is still time to re-plan.
- Vendor on-time and lead-time performance by material
- WIP by process stage, with the accumulation located
- Delivery risk against the customer commitment
Persona Value
Manufacturing Intelligence for Every Team Driving Performance.
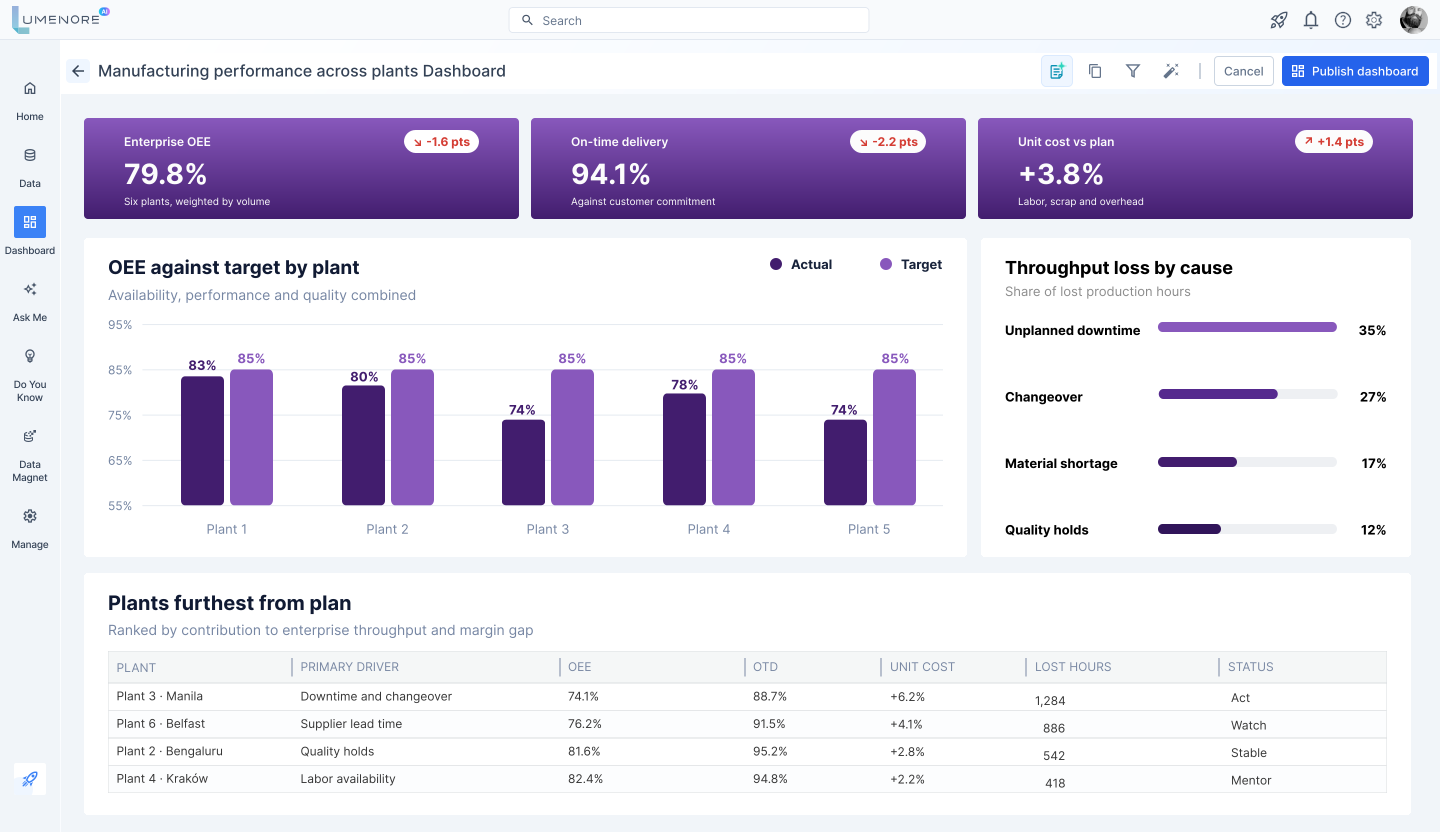
For: Chief Operating Officers · VPs of Manufacturing
Where Are We Losing Throughput, Margin or Delivery Performance?
Cross-plant context, priority issues, and operational-to-financial visibility.
- Cross-plant context
- Priority issues
- Operational to financial visibility
For: Plant Managers · Site Leadership
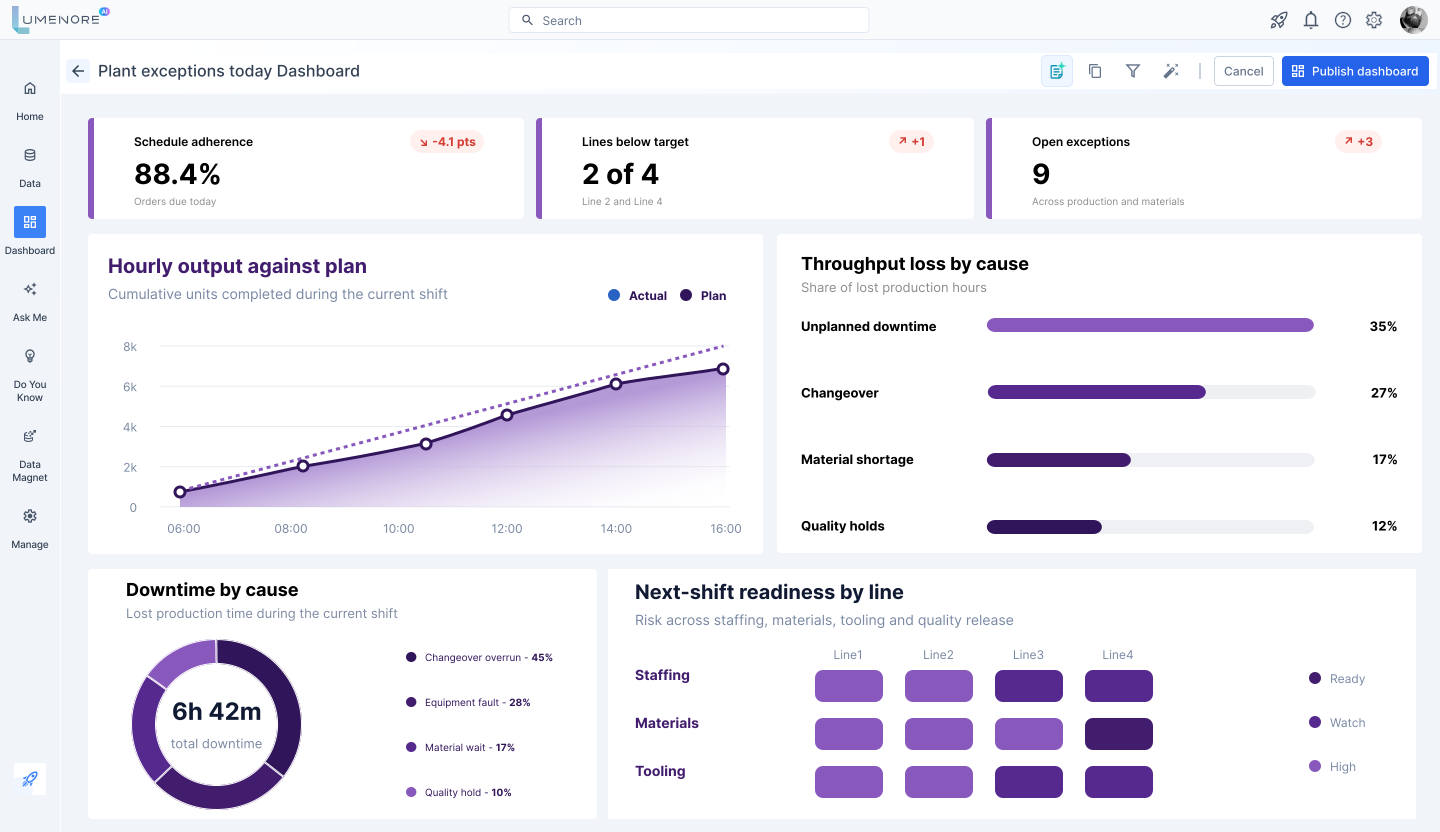
What Needs My Attention Today?
Production, WIP, downtime, quality, staffing, and material context in one decision flow.
- Production
- WIP
- Downtime
- Quality
- Staffing
- Materials
For: Production Managers · Line and Shift Leaders
Where Are Production Losses Occurring, and Why?
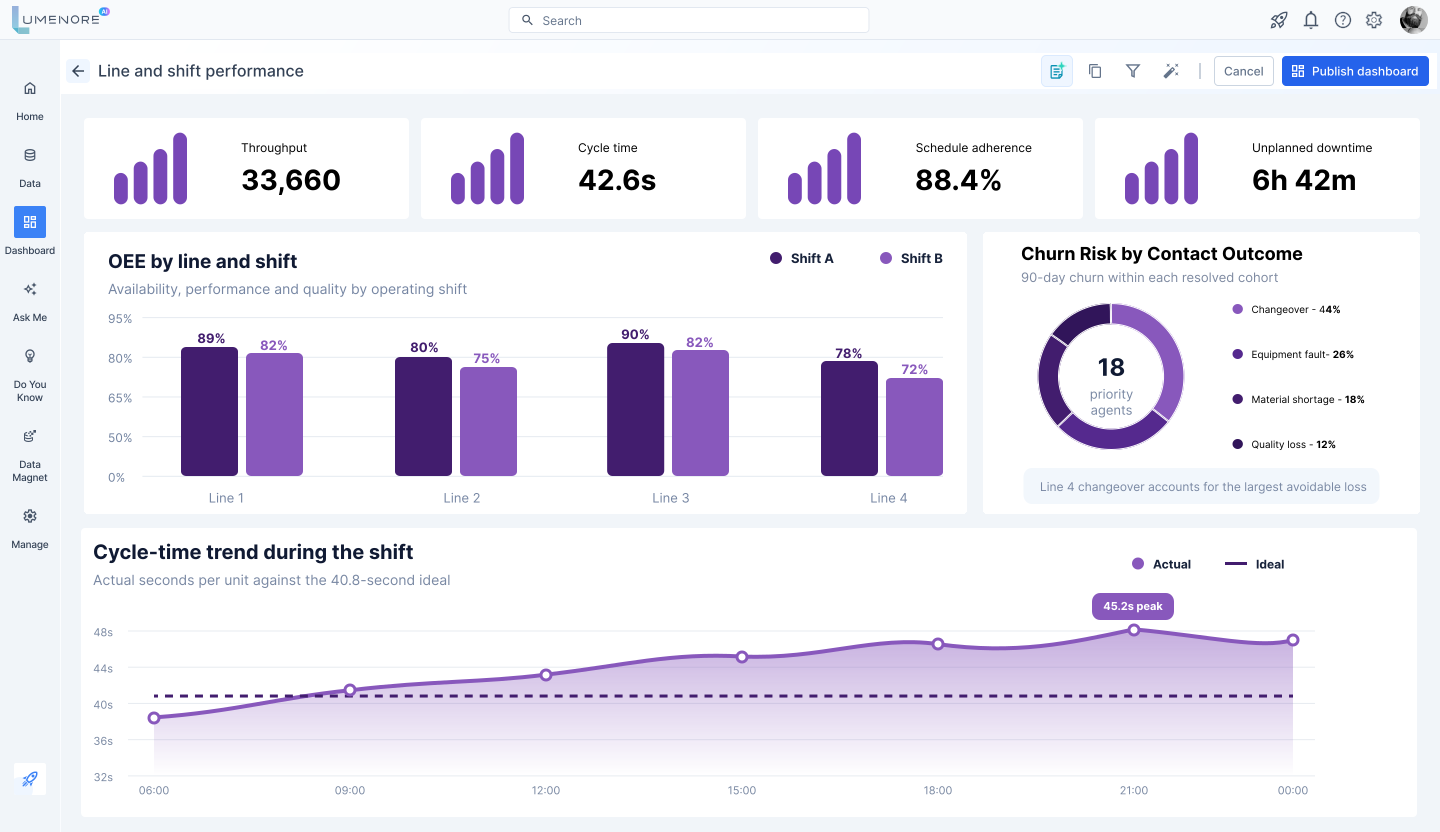
Line and shift analysis, OEE, cycle time, throughput, schedule adherence, and RCA.
- Line & shift analysis
- OEE
- Cycle time
- Throughput
- Schedule adherence
- RCA
For: Quality Leaders · Continuous Improvement Teams
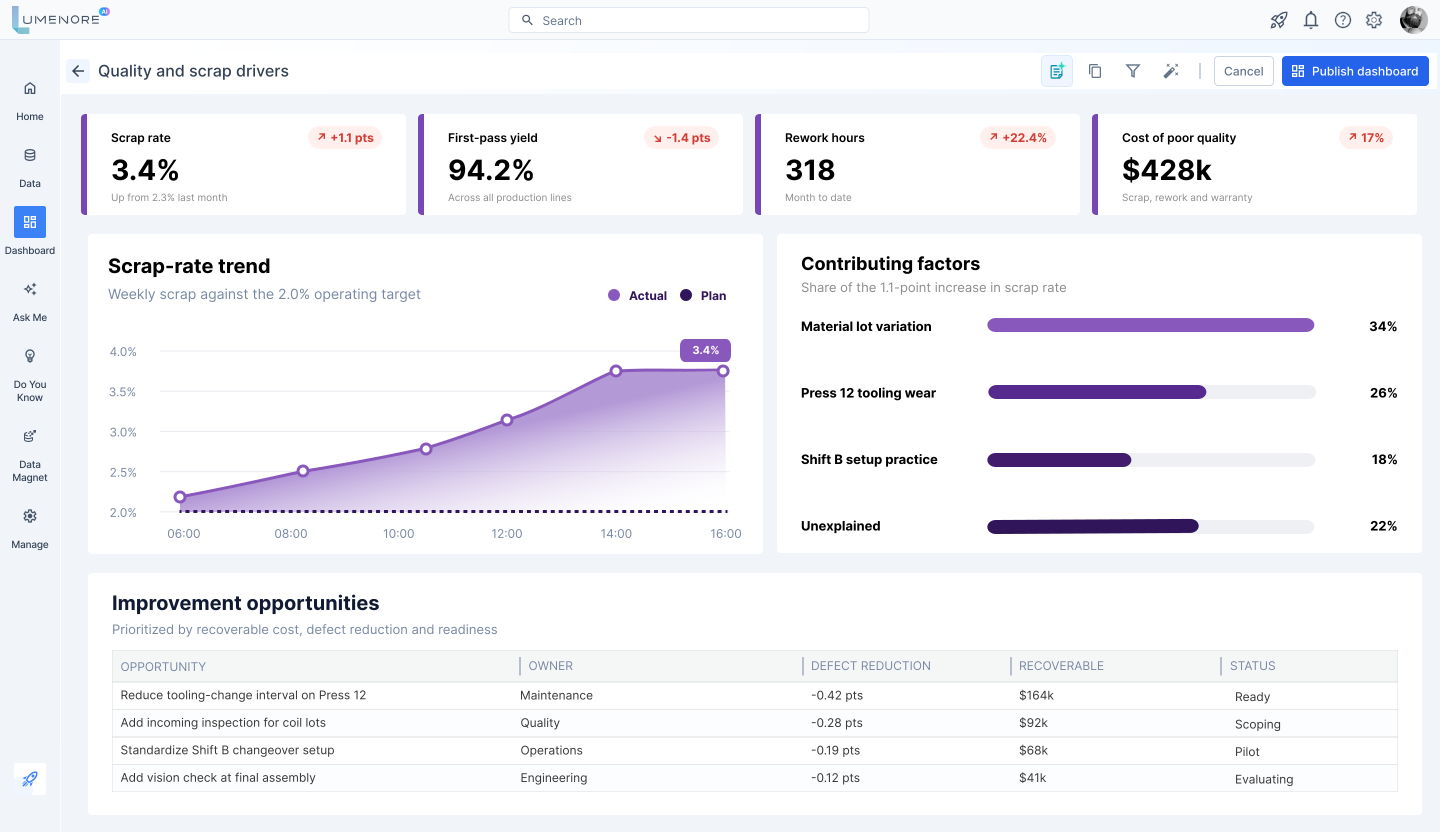
Which Conditions Are Driving Defects, Scrap or Rework?
Quality patterns, contributing factors, and prioritized improvement opportunities.
- Quality patterns
- Contributing factors
- Prioritized opportunities
For: Supply Chain Leaders · Procurement Teams
Where Could Suppliers or Inventory Disrupt Production?
Vendor performance, shortages, WIP, inventory risk, and production alignment.
- Vendor performance
- Shortages
- WIP
- Inventory risk
- Production alignment

For: Finance Leaders · Plant Controllers
Where Are Labor, Scrap, Overhead and Procurement Costs Changing?
Cost driver analysis tied to operational performance.
- Labor
- Scrap
- Overhead
- Procurement
- Cost-driver analysis

For: CIOs · CDOs · Heads of BI and Analytics
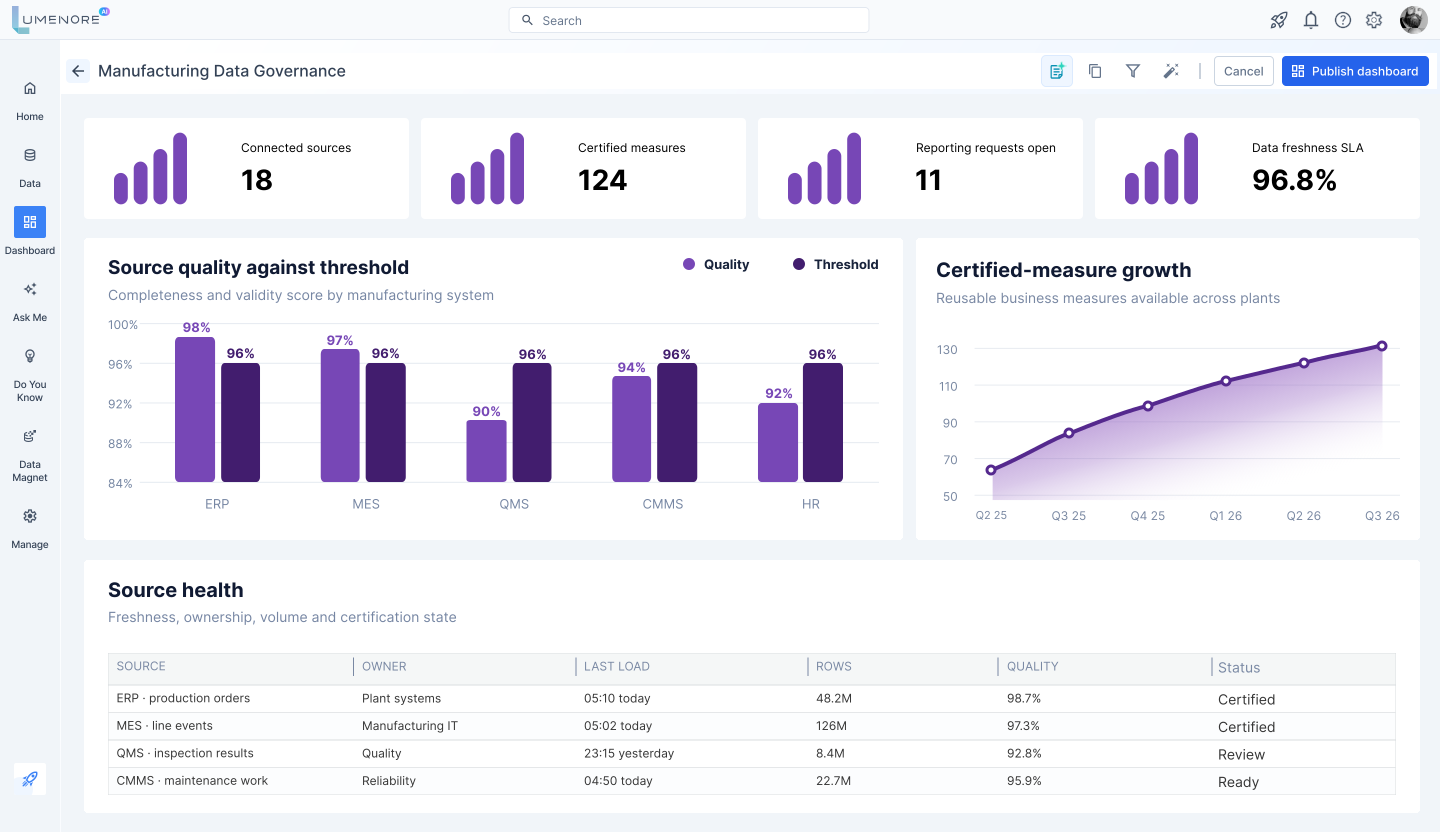
How Do We Connect Manufacturing Data and Reduce the Reporting Backlog?
Governed integration, reusable analytics, business context, and controlled AI access.
- Governed integration
- Reusable analytics
- Business context
- Controlled AI access
Connected Manufacturing Data
Connect the Context Behind Every Manufacturing Decision.
Manufacturing analytics becomes more useful when production signals can be understood alongside quality, inventory, supplier, workforce, and financial context. Lumenore provides an analytics and data integration layer that brings supported sources into a reusable, governed decision environment.
Decision Users
- Executives
- Plant operations
- Production
- Quality
- Supply chain
- Finance
- Data & analytics
Lumenore Analytics Layer
- Data integration
- Governed business context
- Dashboards
- Conversational analytics
- Root cause analysis
- Data science & prediction
- AI agent routing
Manufacturing Data Context
- ERP
- MES
- IoT / SCADA
- QMS
- CMMS
- WMS
- Planning & forecasting
- Supplier & procurement
- CRM & orders
- Finance & cost
- HR & workforce
- Custom operational reports
Keep your operational systems of record. Lumenore sits above the manufacturing data environment to connect, analyze, and explain the information those systems generate.

Customer Story
From Week-Old Reports to Near Real-Time Manufacturing Intelligence.
A leading global automotive parts manufacturer operating multiple plants across North America and Europe faced disconnected procurement, production, inventory and finance data, limited WIP visibility, delayed reporting and difficulty identifying bottlenecks and root causes.
Lumenore consolidated ERP, HR and custom operational data into a unified analytics environment, giving plant managers and leadership near real-time visibility into WIP, vendor shipment performance, actual versus forecast sales, scrap and wastage.
- 1 week → secondsReporting cycleReporting cycle reduced from up to one week to near real-time production and spend visibility.
- 30%WIP trackingClearer, more continuous WIP tracking.
- Real-timeCost driversTracking of labor, scrap, and overhead cost drivers.
- Significant reductionManual reportingIn manual reporting, with easier self-service access for business users.
The result was stronger operational visibility, earlier bottleneck identification, and a more consistent view of production and cost performance across the business.
Technology Behind the Experience
The Technology Behind the Manufacturing Analytics Experience.
Lumenore combines conversational analytics, advanced analytics, visualization, dashboards and data integration, so manufacturers can move from monitoring known KPIs to investigating emerging questions within the same platform.
Agentic Conversational Analytics
Use natural language to explore manufacturing data while specialized AI agents interpret questions, orchestrate the right analytical capabilities, and deliver contextual answers, visualizations, and deeper analysis.
Advanced & Root Cause Analytics
Apply forecasting, trend analysis, anomaly detection, correlation, and root cause analysis to understand manufacturing performance and identify the factors driving change.
AI-Powered Visualization & Dashboards
Create, explore, and refine interactive dashboards and visualizations across plants, lines, machines, products, shifts, and other operational dimensions.
Data Integration & Preparation
Connect, prepare, transform, and orchestrate operational and enterprise data to create an analytics-ready foundation for manufacturing use cases.
Agentic RAG
Extend manufacturing analytics beyond structured data by enabling AI-powered analysis of relevant documents and unstructured content alongside business data.
MCP & Connected Intelligence
Connect conversational analytics with external context, tools, and services through MCP (Model Context Protocol) to enrich analysis and support broader intelligent workflows where enabled.
Trust & Governance
Governed Analytics for Manufacturing Teams.
Faster answers only matter when the underlying access, context and analytical evidence can be trusted. Lumenore is built to keep AI-assisted analysis inside enterprise controls.
Role-Based Access
Users see the information their role and permissions allow, with row-level security available for controlled data access.
Governed Business Context
Shared definitions and curated data context help teams interpret manufacturing KPIs consistently.
Supporting Metrics & Explanations
Analytical outputs can include the metrics, drivers, and context behind the result, so users can inspect what informed the answer.
Human Oversight
Plant, quality, supply chain, and finance leaders retain judgment over consequential operational decisions.
Controlled Actions
Recommendations, alerts, and workflow handoffs stay distinct from autonomous operational execution.
AI Guardrails
Enterprise rules and controls apply around the data and analytical experience available to each user.



Lumenore is an analytics and decision layer. It does not perform machine-level control, PLC intervention or safety-critical execution, and it does not replace MES, SCADA or ERP systems.
What Manufacturing Decision Are You Trying to Improve?
Lumenore turns plant data into faster, clearer decisions.