
Which customers, regions, or business factors are contributing most?
AI + Agentic Analytics for Finance
Financial Analytics That Finds the Why, and Shows You What to Explore Next
Ask a question in plain language, and Lumenore Ask Me doesn’t just hand back a number. It investigates what changed, digs into why it changed, and points you toward what’s worth exploring next.
Finance leaders and analysts can chase down the story behind a performance shift and use AI-assisted analysis to understand what might happen next, without another report request or a hunt through dashboards.
Bring one of your finance questions. We’ll show you how Lumenore approaches the analysis.
Ask MeFinance workspace
Finance user
Why did gross margin decline versus plan this quarter?
Ask Me
Margin is 2.4 points below plan. Product mix and higher input costs explain most of the variance.
Finance user
Which products and regions contributed most?
Ask Me
West region and the Enterprise line account for 61% of the movement. Explore the supporting drivers?
The Big Idea
Your Finance Team Sees the Number. The Cause May Be Somewhere Else.
Finance systems are great at telling you what happened. Why it happened is usually a different story, and it doesn’t always live inside finance. Lumenore brings financial and operational context together so your team can trace a number back to what is actually driving it.
- Cash Position DeclinesSlower collections, payment timing, order or delivery issuesAR/AP, billing, CRM, orders
- Budget Variance WidensUnplanned spend, vendor cost changes, project overrunsERP, procurement, project data
- Revenue Falls ShortPipeline movement, churn, pricing or delivery issuesCRM, billing, sales, operations
- Margin CompressesCost inflation, discounting, product or customer mixERP, sales, procurement, supply chain
- Forecast Variance GrowsChanging demand, stale assumptions, operational shiftsERP, CRM, operational data
Definition
What Is Financial Analytics?
Financial analytics is how organizations use financial and operational data, analytics, and AI to understand performance, identify trends and drivers, monitor important metrics, and anticipate what may happen next.
It brings profitability, revenue, expenses, cash flow, working capital, budgets, receivables, and their operational drivers together so finance teams can move from reporting a number to understanding what shapes it.
-
01What Happened?
Monitor and describe financial performance.
-
02Why Did It Happen?
Investigate variances, drivers, correlations, and contributing factors.
-
03What’s Changing?
Identify trends, anomalies, and emerging patterns.
-
04What Might Happen Next?
Apply forecasting and predictive techniques where the data supports it.
-
05Where Should We Focus?
Prioritize the areas that merit deeper business investigation.
With Lumenore, that journey can start with one question, typed the way you would ask a colleague.
The Decision Gap
Your Dashboard Says the Number Changed. Now What?
Dashboards are useful for watching the metrics you already know to track. But when something moves, the most important questions usually begin after the alert fires.
Which departments or cost categories are driving it, and is the pattern recurring?
Which products, customers, or regions explain the shortfall?
Is the movement mostly about price, cost, discounting, or mix?
Which customer segments or aging bands deserve investigation first?
Lumenore combines steady monitoring with conversational exploration so your team can go from seeing a change to understanding it without switching tools.
Ask Me for Finance
Ask the Question. Lumenore Orchestrates the Analysis.
Finance users should not need to decide whether a question requires a KPI lookup, drill-down, root-cause investigation, forecast, or chart before they ask it. Ask Me reads the intent, routes the request to the right analytical capability, and returns the form of answer that fits.
Ask MeFinance analysis
Pulls up and compares the governed KPIs you need.
Illustrative analysis. Results depend on the connected finance data model, governance and available business context.
Value Framework
From Financial Reporting to Financial Understanding
-
01
Monitor
Track recurring KPIs through dashboards, filters, drill-through, alerts, and notifications where configured.
-
02
Ask
Explore the next business question in natural language through Ask Me.
-
03
Explain
Investigate contributing factors through drill-down, correlation, trends, narratives, and AI-assisted insight.
-
04
Anticipate
Use forecasting, regression, outlier detection, and what-if exploration where the data supports it.
-
05
Decide
Bring metrics, context, visuals, and findings together for human decision-making.
Monitor Ask Explain Anticipate Decide
Financial Analytics Across the Office of Finance
Which Finance Decision Are You Trying to Improve?
Finance leaders may work from the same financial foundation, but they need very different answers. Choose a role to see the decisions and analytical context that matter most.

CFO & Finance Leadership
Where Is Financial Performance Changing, Why, and Where Should Leadership Focus?
Move from reading financial reports to understanding the business behind them.
- Revenue
- Profitability
- Margin
- Cash-related metrics
- Budget performance
- Working capital
- Executive KPIs
- Board reporting
Financial + Operational Context
Reports Tell You What Changed. Operational Data Helps Explain Why.
A financial outcome is often the last link in a chain of operational events. Lumenore connects finance data with customer, sales, billing, procurement, order, project, and other operational information so teams can explore the business context behind a shift.

-
Receivables Increased
Which customers, segments, products, or billing patterns are contributing?
-
Revenue Declined
Is the change concentrated by customer, product, region, pipeline, or delivery performance?
-
Margin Moved
How much relates to price, discounting, cost, product mix, or customer mix?
-
Spend Increased
Which departments, vendors, categories, or projects explain the change?
-
Cash Pressure Emerged
How are collections, payment timing, revenue, and operating patterns contributing?
Structured + Unstructured Intelligence
Go Beyond Rows and Columns
Targets, assumptions, commentary, policies, reports, and supporting documents often carry context that changes how a number should be read. Ask Me can bring structured business data and relevant unstructured content into one analytical conversation.
Where enabled, external or market intelligence can sit alongside internal analysis for a wider view.
Structured DataERP / warehouse actuals
Revenue and margin data
Customer and billing dataDocuments & ContextBudgets and targets
Management commentary
Contracts and policies
Revenue and margin data
Customer and billing dataDocuments & ContextBudgets and targets
Management commentary
Contracts and policies
One Ask Me Analysis
How do actual results compare with the documented target by region?

Predictive Financial Analytics
Move From Reactive Reporting to Earlier Decisions
Advanced and predictive analytics can help finance teams identify patterns, unusual behavior, and shifting conditions earlier. It does not replace finance judgment; it adds another evidence layer for deciding what deserves attention next.
- Track financial trends over time.
- Explore direction with forecasting.
- Flag unusual shifts earlier.
- Test relationships with potential drivers.
- Compare supported what-if scenarios.
- Prioritize patterns worth a closer look.
Connected Data Foundation
One Financial Question Can Span Multiple Business Systems
Revenue may sit in ERP and billing systems. Customer context lives in CRM. Targets are maintained in files. Operational drivers appear in procurement, supply chain, project, and other platforms.
-
01
Connect
Access business systems, databases, files, APIs, cloud platforms, and warehouses.
-
02
Prepare
Use Data Magnet to integrate and prepare analytics-ready data through low-code pipelines.
-
03
Govern
Apply role-based access, dataset controls, semantic definitions, and AI governance.
-
04
Analyze
Use Lumenore Insights for dashboards, predictive analysis, visual exploration, and narratives.
-
05
Ask
Use Ask Me to explore governed data through natural-language questions and follow-ups.
From fragmented financial data to one connected analytical experience.
Trusted Agentic Analytics
Better Financial Decisions Require More Than Better AI
Financial decisions touch cash, reporting integrity, compliance, and stakeholder trust. AI-assisted analytics needs intelligence and control in equal measure.

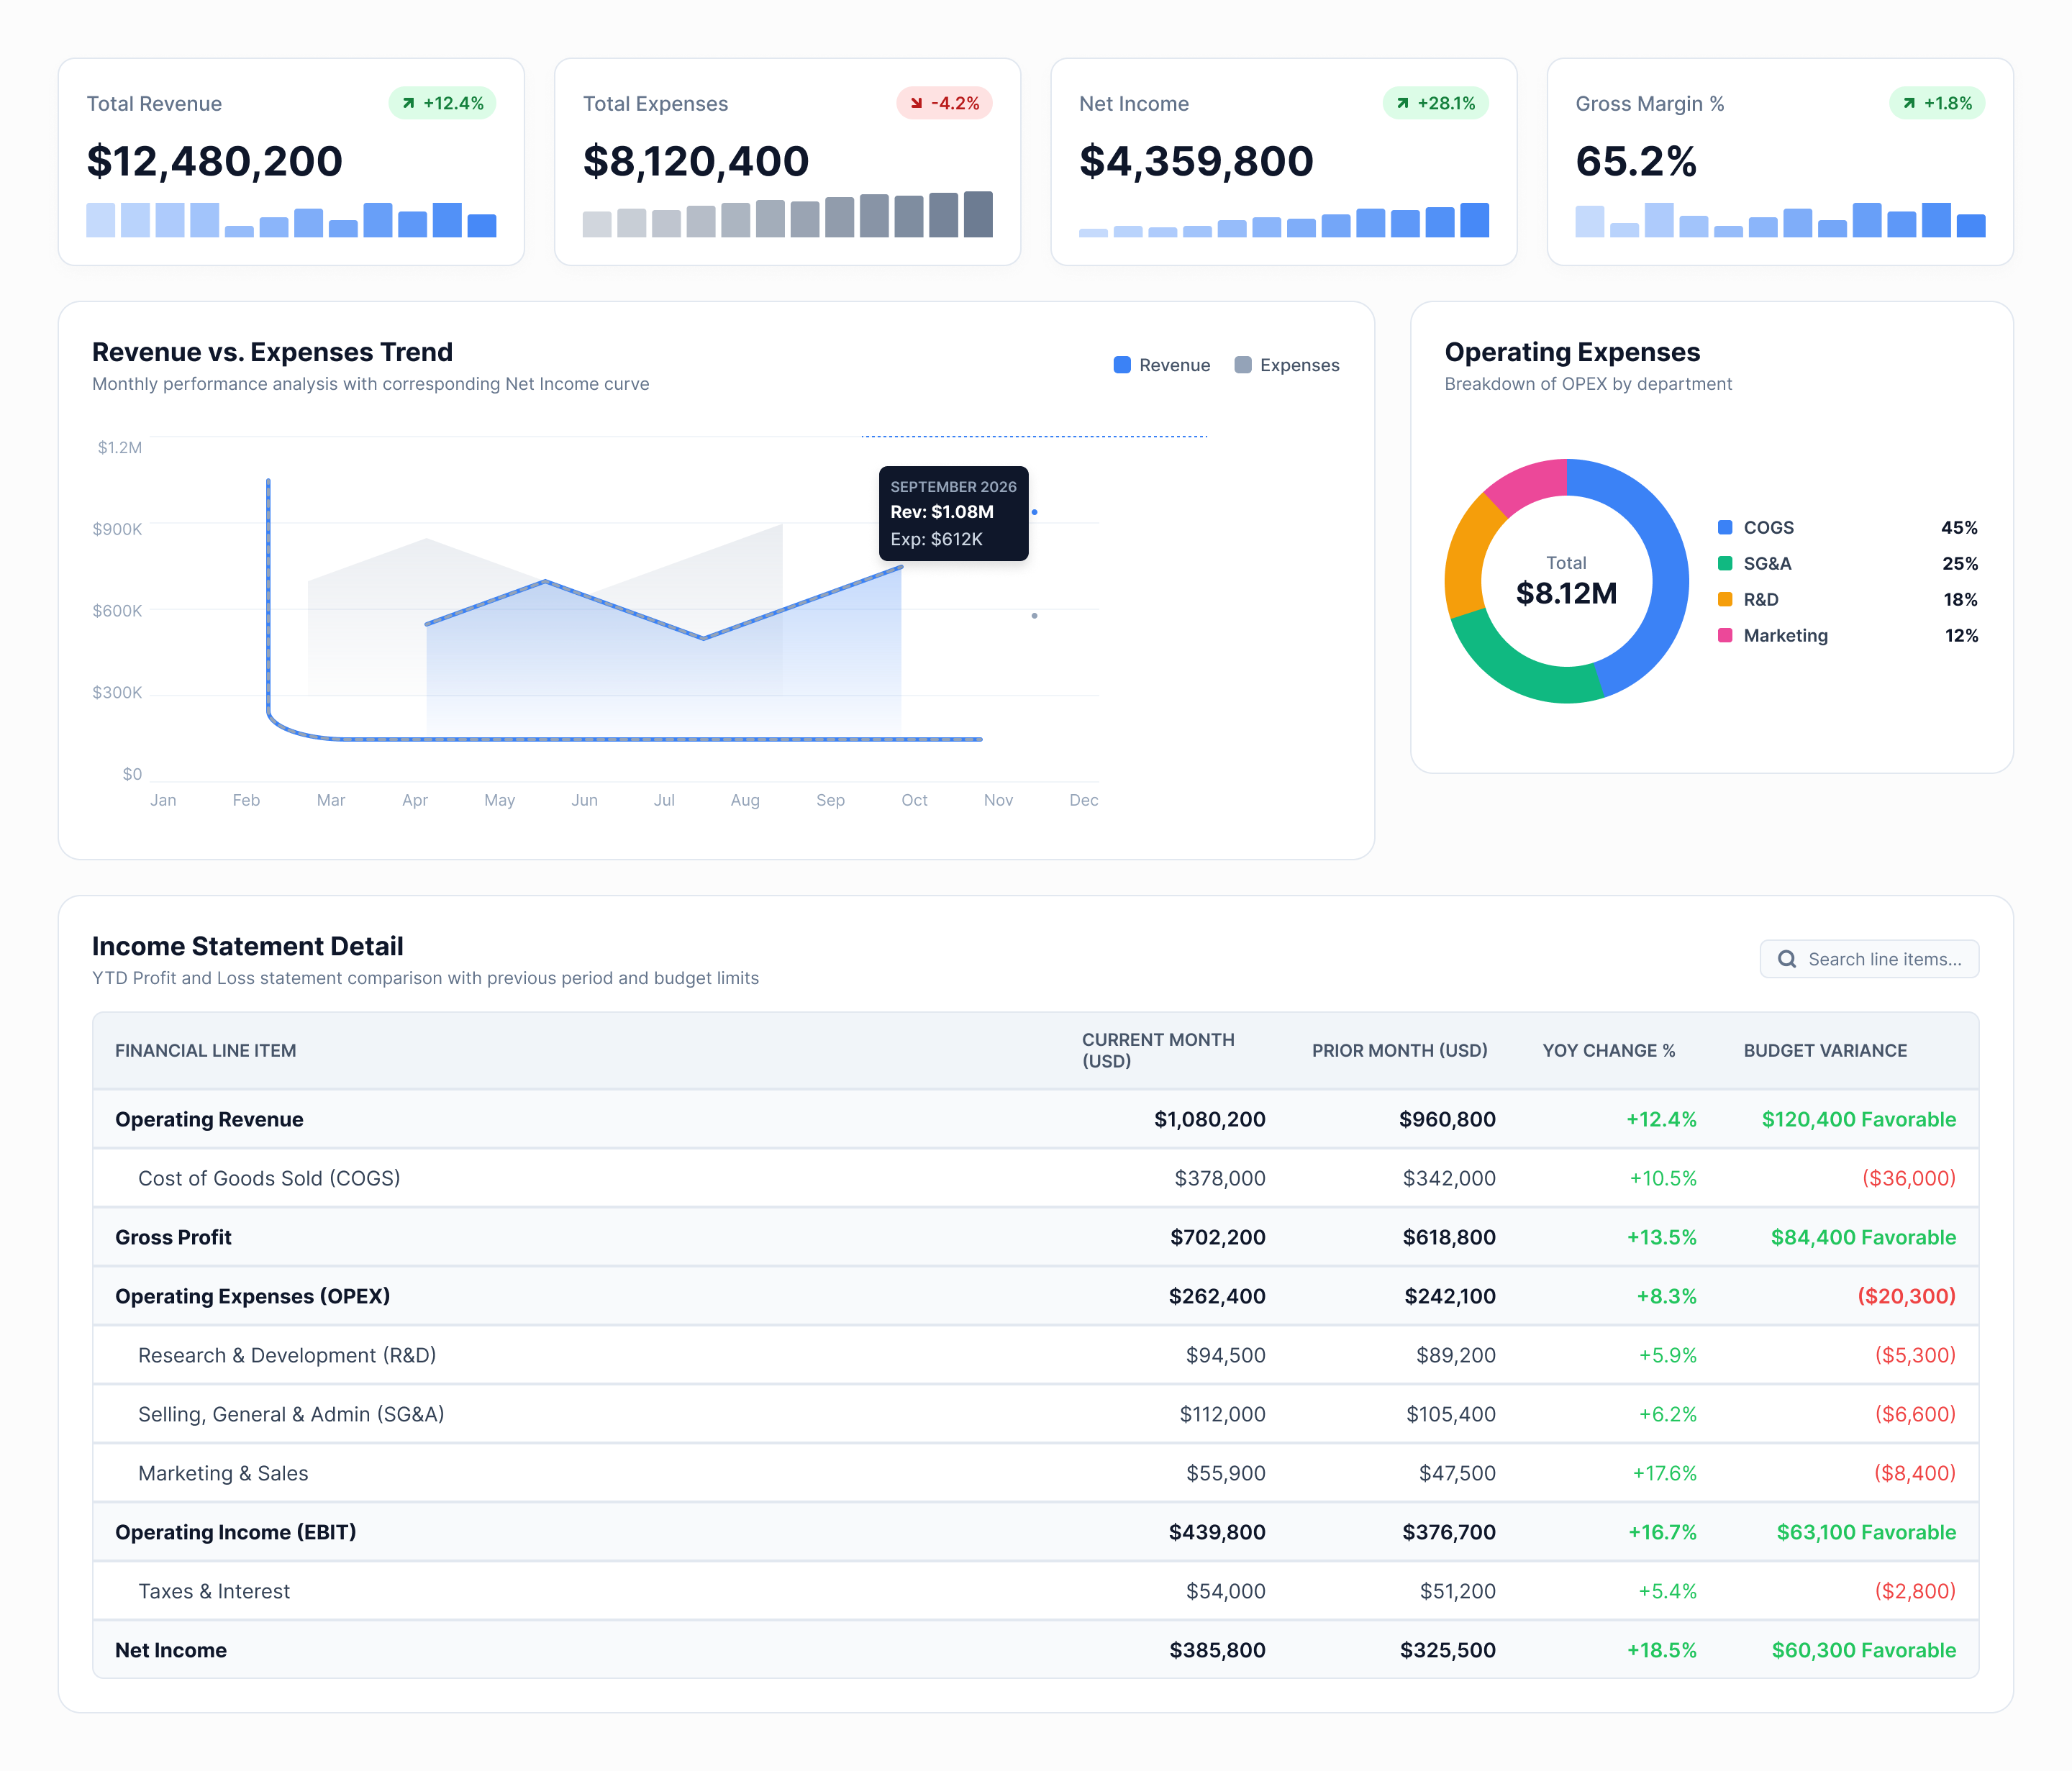
Dashboard Gallery
Dashboards Still Matter. They Just Shouldn’t Be the Only Way to Get an Answer.
Use dashboards to monitor the KPIs you already know to track, then turn to Ask Me when a new question appears that the dashboard was not built to answer.


Why Lumenore
Why Lumenore for Financial Analytics?
-
01
Start With the Question
Give finance users a conversational way into data instead of routing every ad-hoc question through a predefined report.
-
02
Move Naturally Into Deeper Analysis
Use the right analytical capabilities for root-cause exploration, visualization, trends, forecasting, and advanced analysis.
-
03
Connect Finance to Business Context
Bring financial and operational information together to trace an outcome back to what is driving it.
-
04
Combine Conversation and Dashboards
Use Ask Me for ad-hoc investigation and interactive dashboards for recurring monitoring.
-
05
Support Self-Service With Governance
Give users analytical independence without loosening access, shared definitions, or AI governance.
-
06
Extend From Data to Decision
Work across data integration, self-service BI, conversational analytics, advanced analytics, and decision support.
Your Next Finance
Question
Stop Waiting for the Next Report. Ask the Question.
See how Lumenore can help your finance team move from reporting numbers to understanding what is behind them.
Bring one of your finance questions. We will show you how Lumenore approaches the analysis.
