Uncovering Data’s Hidden Stories: The Role of Narrative Insights
6 mins read
Over 90% of data ever created was generated in the last two years. However, most businesses analyze only 37-40% of their data. The sheer volume of data produced and its complexity can often obscure the value. The question remains: can numbers speak for themselves, as many claim, or do they require a voice to uncover the story buried underneath them?

Conventional data visualization tools may fall short of conveying the complete narrative behind the numbers, leaving decision-makers grappling with conflicting and confusing interpretations of intricate charts and graphs. If we cannot form cohesive arguments with data at our fingertips, can we really make a good case for data-driven decision-making?
Enter narrative insights, a bridge over the critical gap between raw data and actionable knowledge to help businesses leverage the true potential of data and drive informed decisions leading to overall success.
What are Narrative Insights?
Simply put, narrative insights are AI-powered textual summaries that provide context and clarity to data visualizations. They transform complex data into concise, human-readable narratives, distilling the essential findings, trends, and patterns for effortless comprehension. This rather potent combination of data analysis and natural language generation (NLG) capabilities can unveil hidden stories that are often lost.
At Lumenore, we have made interactions with data meaningful and fulfilling by incorporating the narrative insights feature into our AI-driven business intelligence platform. Our solution generates insightful narratives explaining the “what” and the “why” behind visualizations, offering explanatory narratives and contextual information. With narrative insights, businesses can access near real-time, dynamically updated narratives that adapt to their data exploration, ensuring they never miss a crucial insight.
Narrative Insights: Reading between the Data
Generating narrative insights seamlessly combines data analysis and natural language generation (NLG). Here’s a detailed breakdown of how it works:
Data Analysis – The BI tool ingests data from various sources, including databases, spreadsheets, and cloud applications, and performs comprehensive analysis to identify patterns, trends, outliers, and correlations.
Natural Language Generation (NLG) – Once the data analysis is complete, the NLG algorithms kick into action, converting the structured data and insights into human-readable narratives.
Descriptive Narratives – The generated narratives summarize the key findings, trends, and significant changes or developments observed in the data, providing a high-level overview.
Explanatory Narratives – Besides descriptive narratives, the tool also offers explanatory narratives that delve deeper into the reasons behind observed trends or patterns, adding valuable context.
Contextual Information – Narrative insights incorporate contextual information such as historical data, benchmarks, or comparisons with previous periods to enhance understanding.
Dynamic and Interactive – Narrative insights are dynamic and interactive, allowing users to explore the data further, ask specific questions, and receive instant responses as additional narratives.
How do Narrative Insights Help?
Narrative insights offer crucial benefits that can transform how businesses use their data. These include:
Improved Data Interpretation – Clear and concise explanations of data visualizations enable users to comprehend complex information effortlessly.
Data Storytelling – Compelling narratives communicate the significance of data-driven insights to stakeholders, fostering a shared understanding.
Enhanced Communication and Collaboration – Narrative insights facilitate better communication and collaboration among teams by providing a common language for data interpretation.
Time Efficiency – Condensing complex visualizations into summarized narratives saves valuable time that would otherwise be spent on extensive analysis.
Informed Decision-Making – Users can confidently identify patterns, correlations, and anomalies, enabling data-driven decisions with greater accuracy.
Accessibility for Non-Analytical Users – Narrative insights cater to users without an analytical background, making data more accessible to wider stakeholders.
Scalability and Efficiency – Extensive datasets can be quickly analyzed and interpreted, allowing for scalability in data analysis and providing insights at a faster pace.
Who are Narrative Insights for?
Narrative insights cater to a diverse range of users within an organization, enabling them to leverage the full potential of their data. They might include:
Basic Data Analysts – Quickly create reports and dashboards while benefiting from natural language summaries and customizable insights based on data analysis results.
Viewers (C-Suite Executives) – Analyze data to make informed decisions by rapidly accessing insights on the chart and dashboard levels, including near real-time insights and alerts.
Dashboard Developers – Design, develop, and maintain reports and dashboards while generating insights across multiple data sources and automating the generation of insights and reports.
Citizen Data Scientists – Extract insights from complex data sets to inform business decisions, with the ability to drill down into visualizations and generate insights at different levels of granularity.
How to Generate Narrative Insights in Lumenore?
Lumenore’s AI-driven BI platform offers a user-friendly and intuitive process for generating narrative insights from your data. Follow these steps to leverage the power of narrative insights:
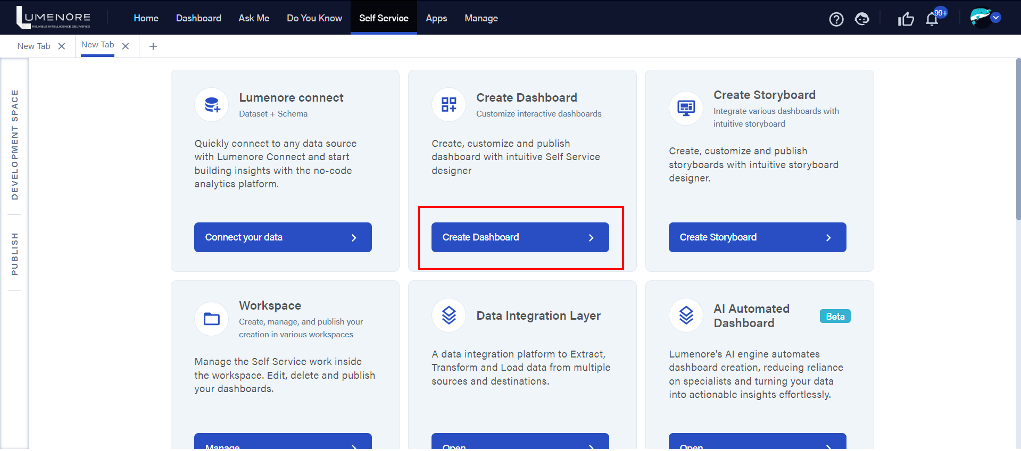
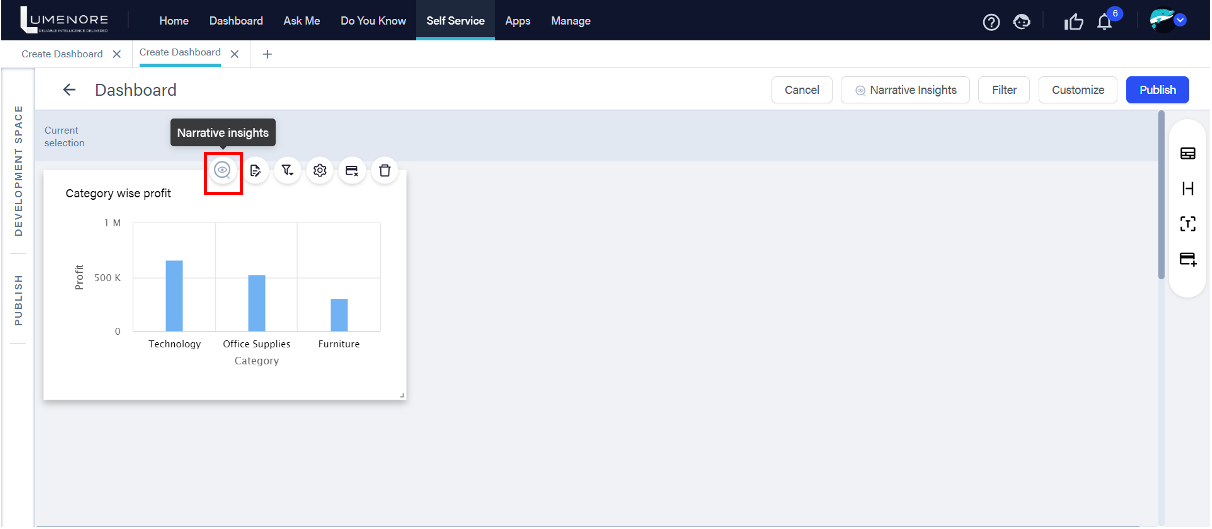
Step 1: Log in to Lumenore using your credentials and navigate to the “Create Dashboard” option, which can be found either on the homepage or the self-service page.
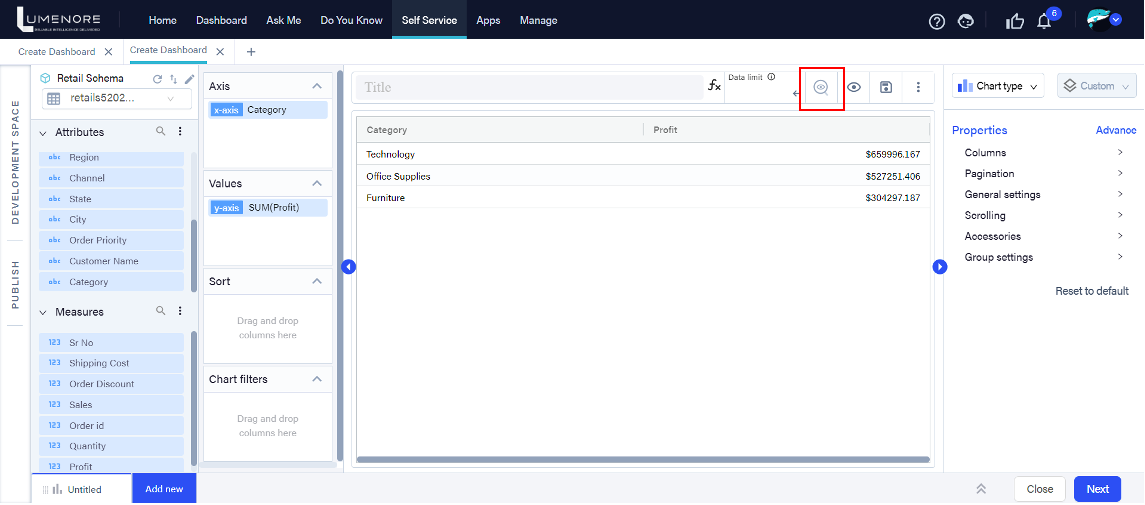
Step 2: Once you have chosen the attributes, measures, and chart type, proceed by clicking on the narrative insight icon positioned at the top of the interface.
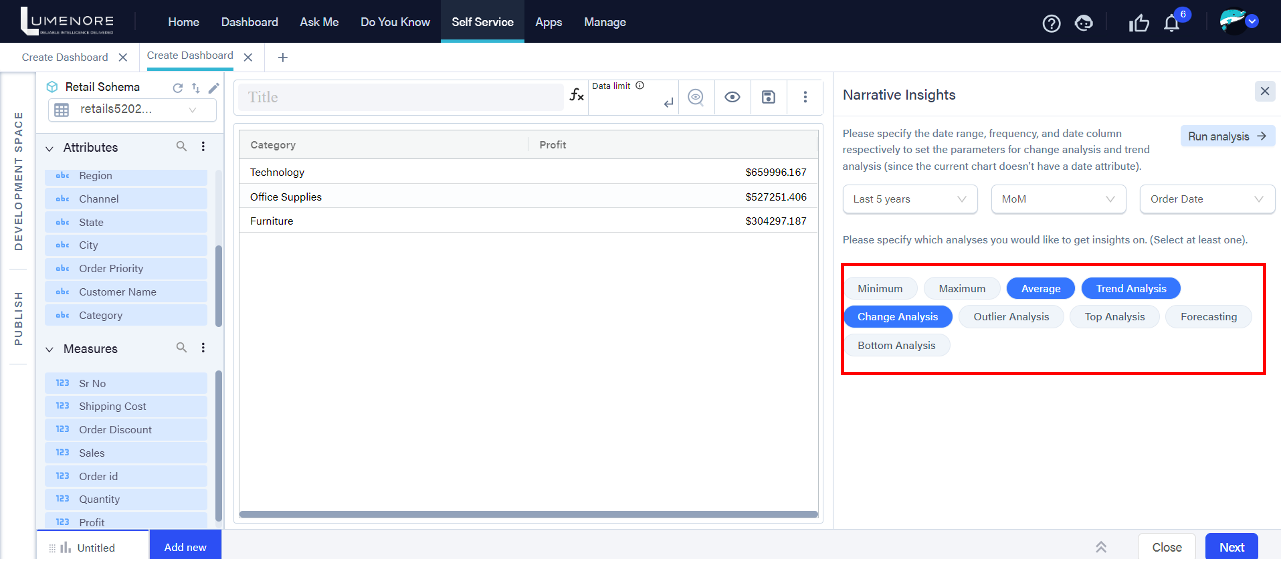
Step 3: Select the desired date range, frequency, and the specific date column for the data analysis.
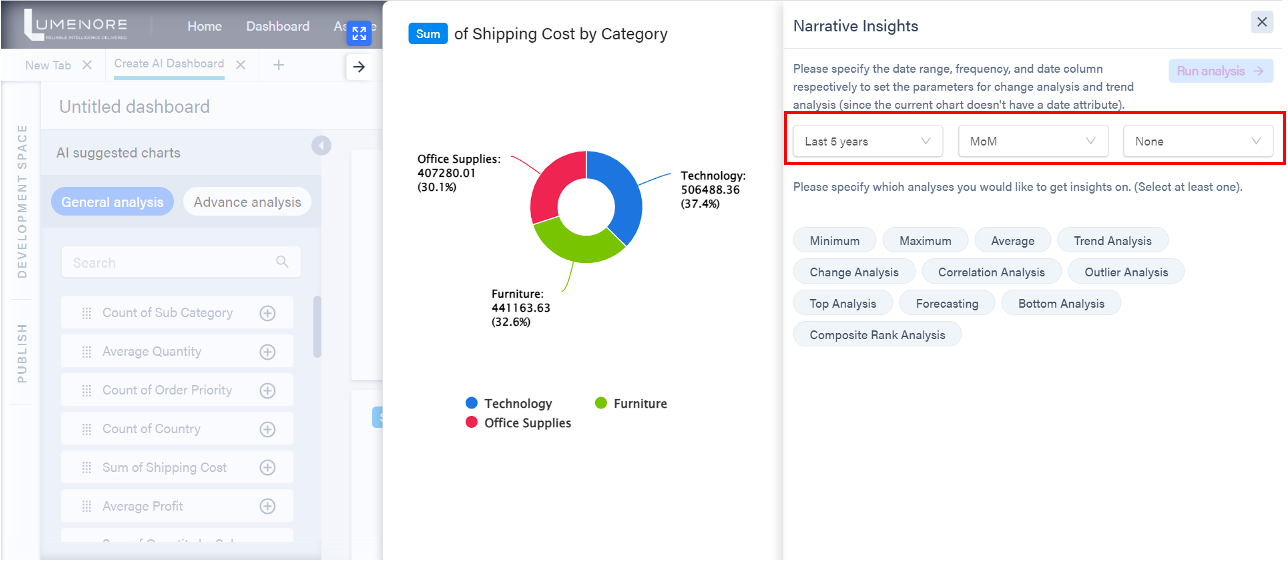
Step 4: Choose the analysis type(s) that suit your requirements to generate narrative insights. You have the option to select one or multiple analysis methods.
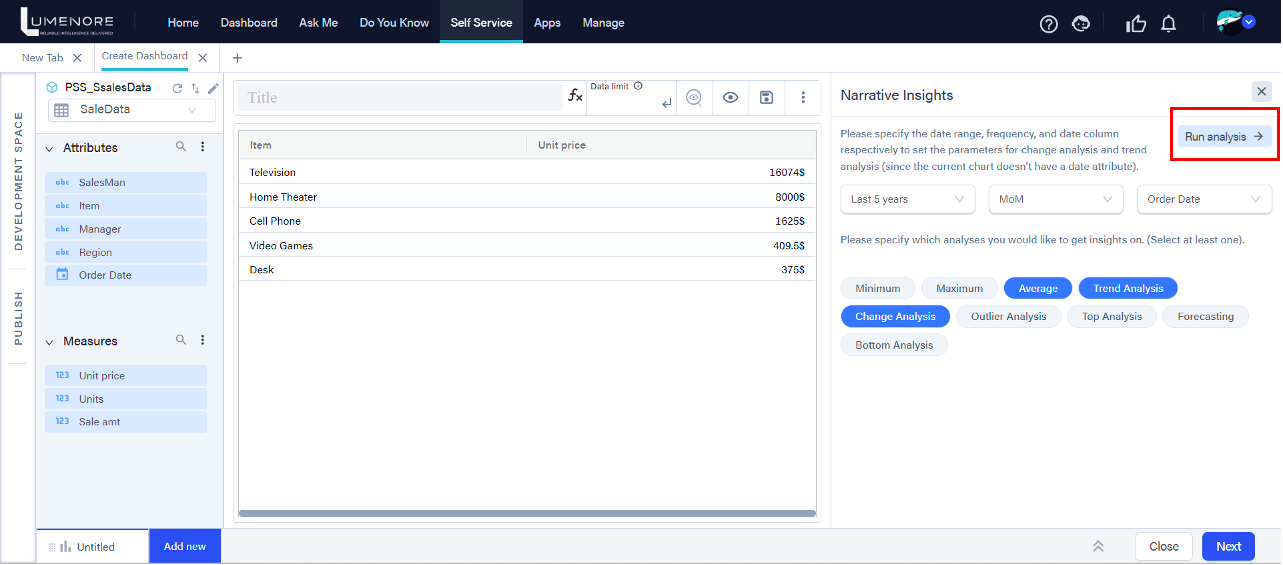
Step 5: Click on “Run Analysis” to initiate the process.
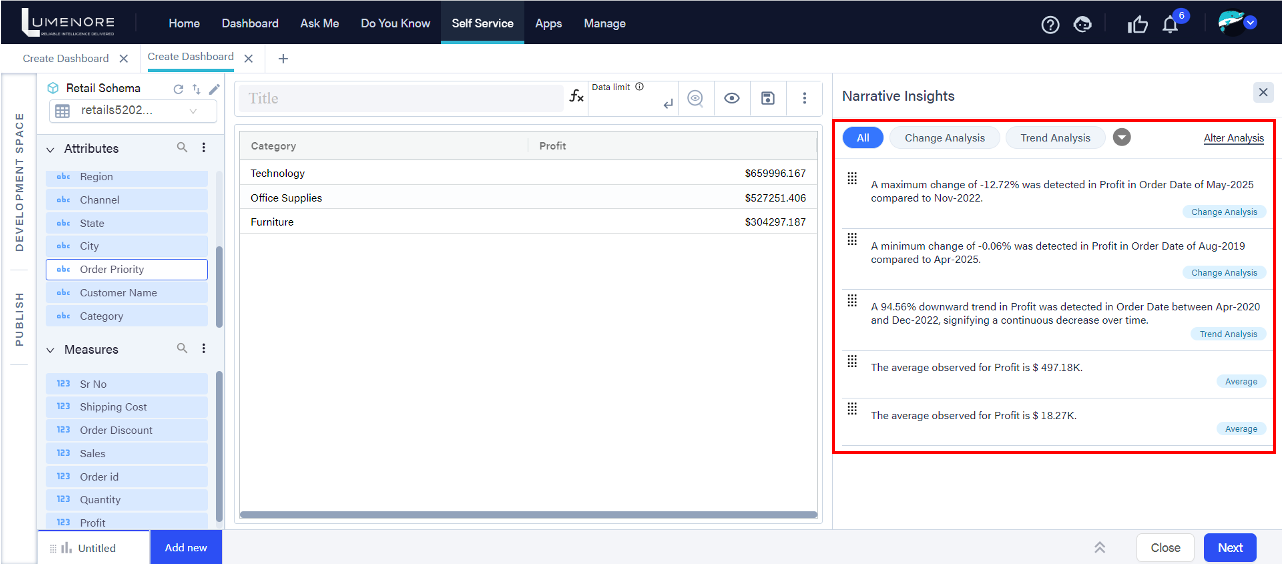
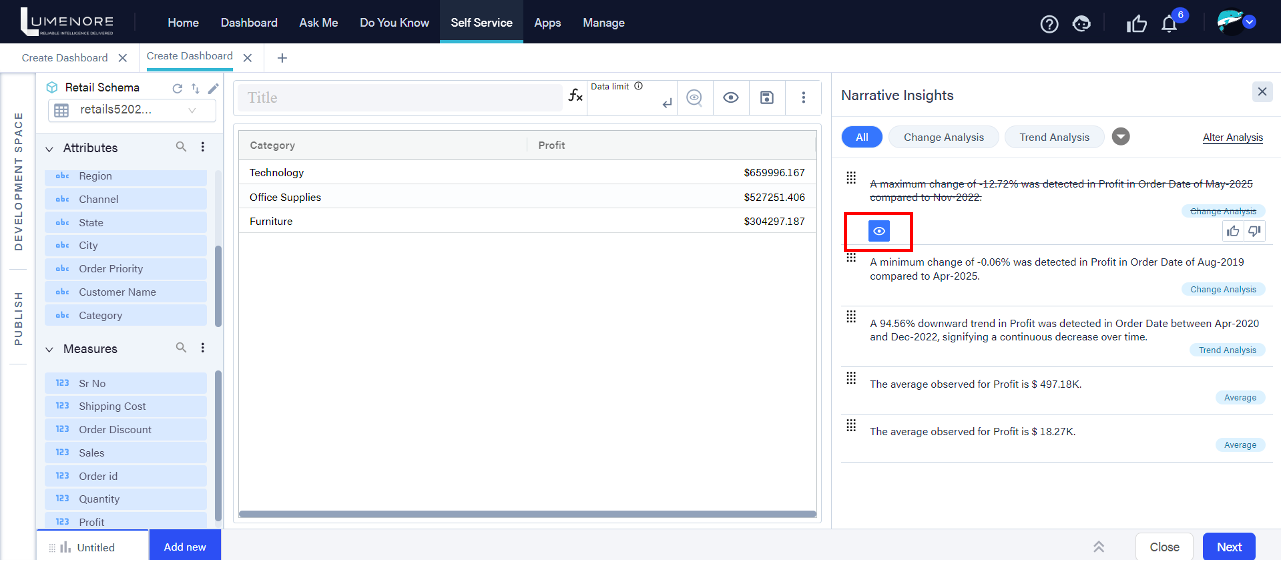
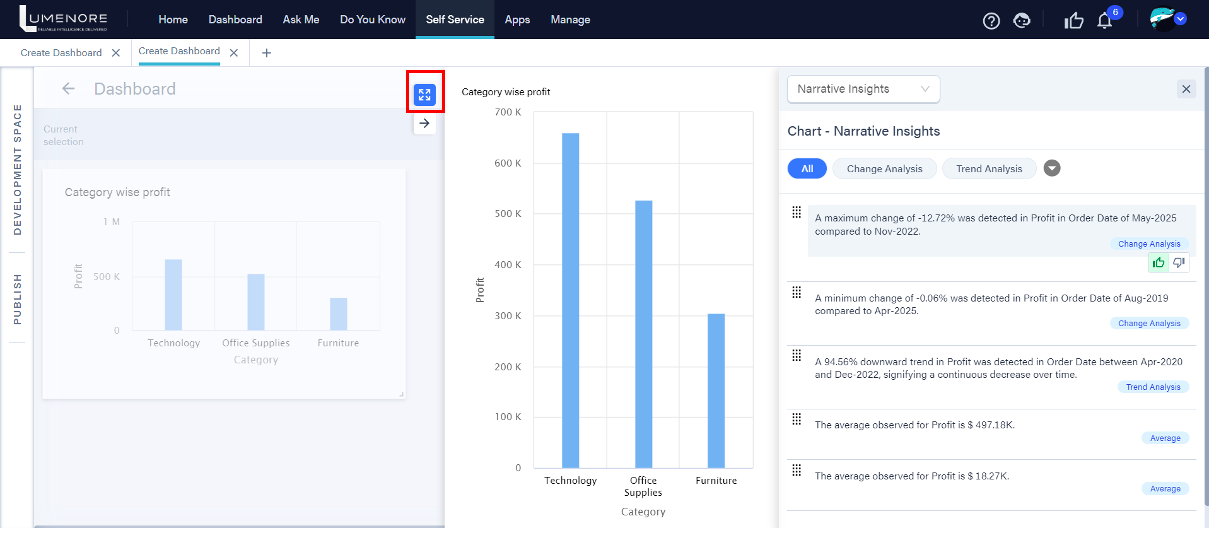
Step 6: You will now see the top narrative insights derived from your data. To view specific insights, choose the desired insight type from the top, such as change or trend analysis.
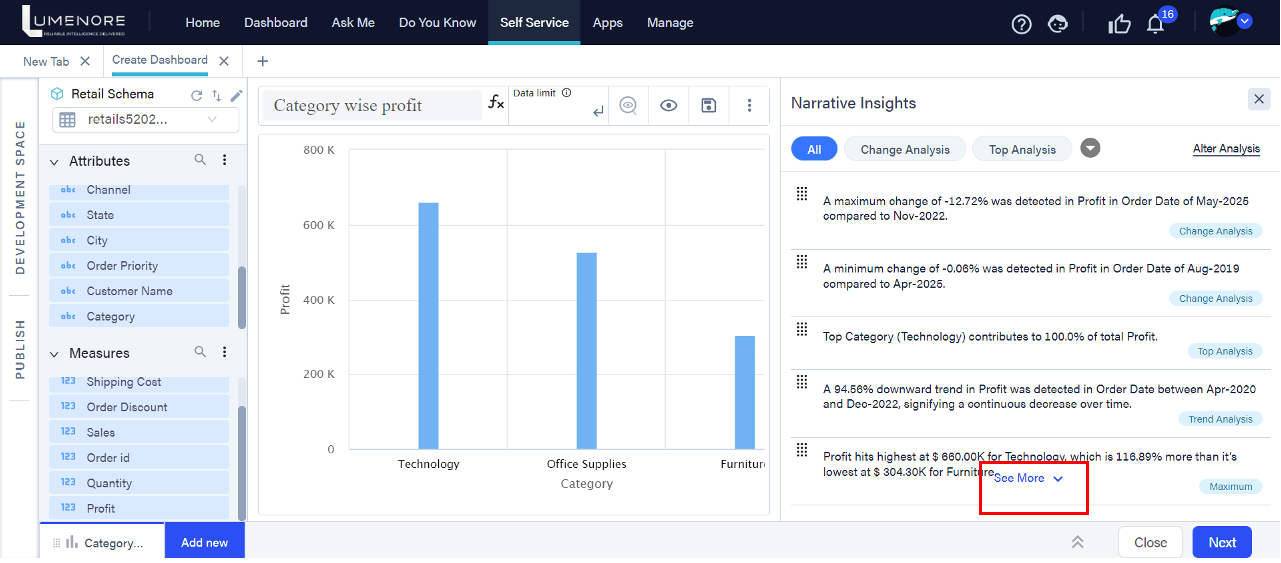
Step 7: Click “See more” to view all available insights. Alternatively, click “Hide” to display only the top 5 insights.
Step 8: Each insight has an “eye” icon feature. By clicking on this icon, you can hide or unhide the insight, allowing you to control which insights are published alongside the KPI.
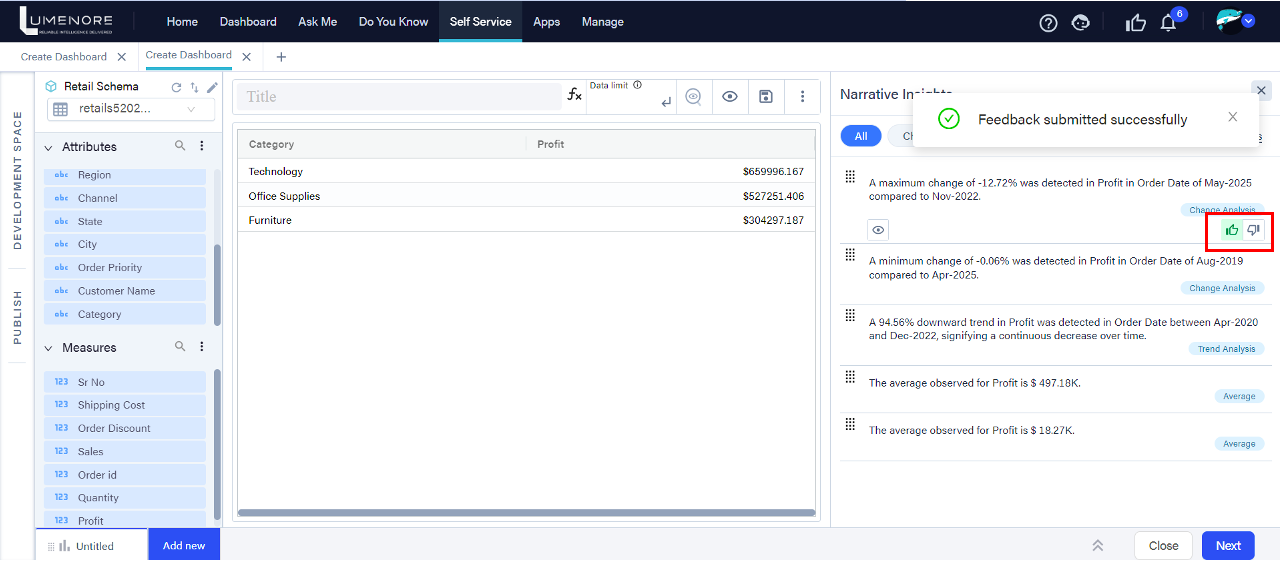
Step 9: Each insight includes a feedback feature represented by thumbs-up and thumbs-down icons. Select the appropriate icon to provide feedback on the insight’s usefulness. The thumbs-down icon will present options for suggesting improvements or providing detailed reviews.
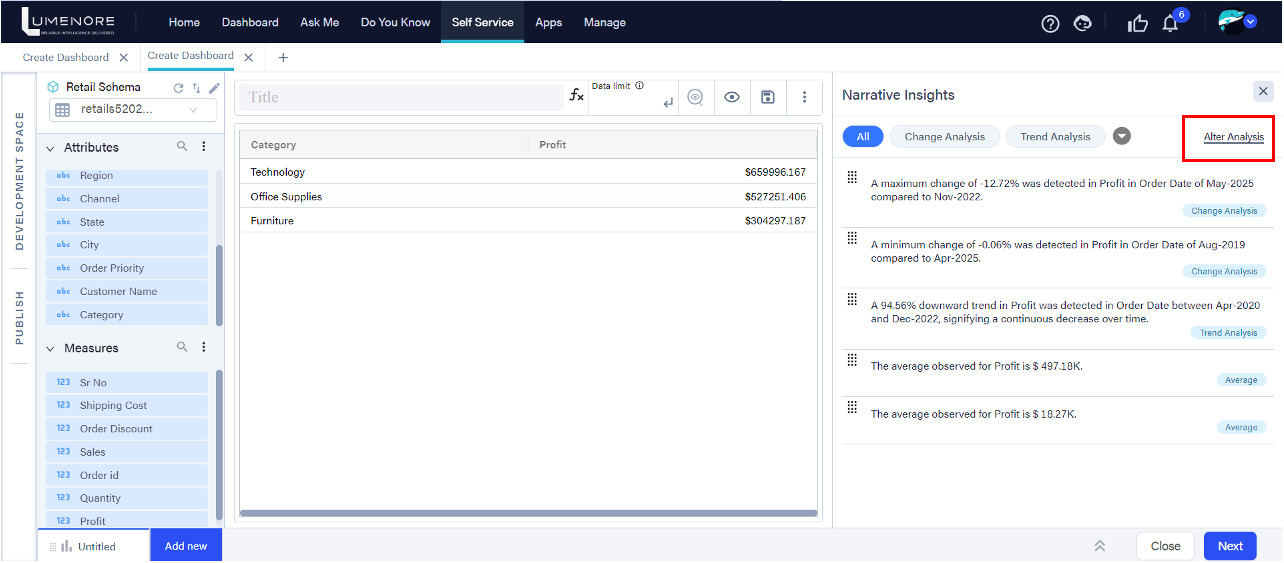
Step 10: If you wish to modify the input data for the insight, select “Alter Insight”. This allows you to adjust the date range or modify the analysis type.
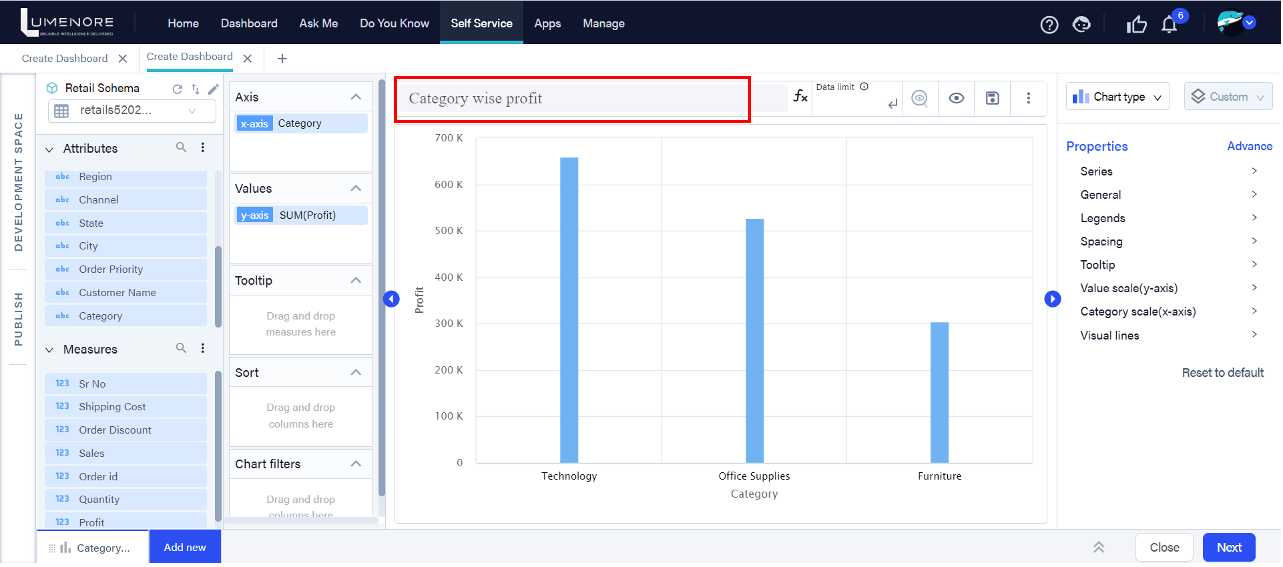
Step 11: Provide a title for your KPI. Note that once you’ve generated insights for a KPI, you can only proceed after providing a title.
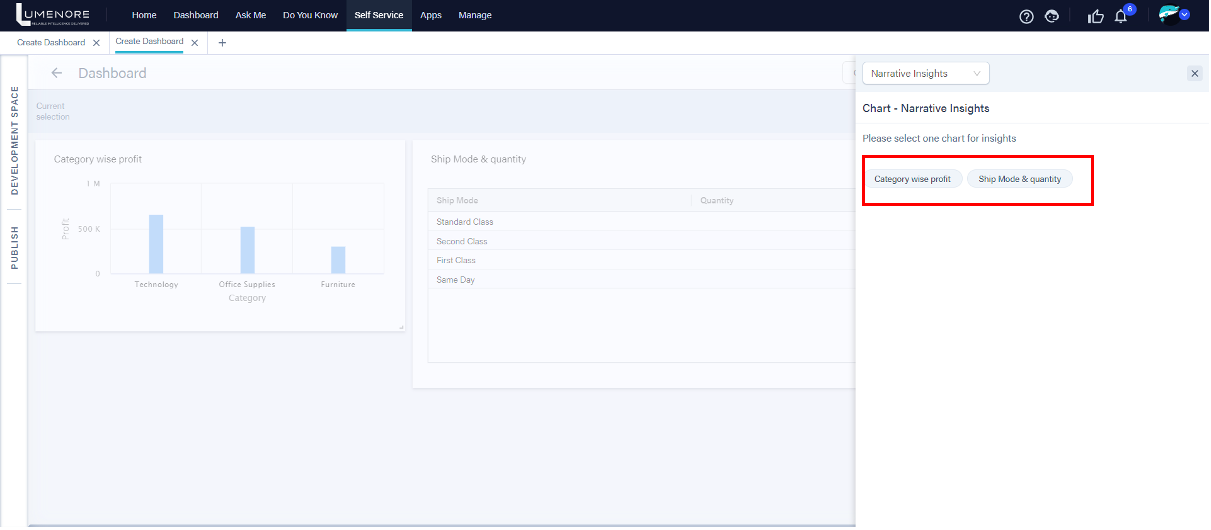
Step 12: After creating the dashboard, you’ll find the “Insight” option on the designer page. It allows you to view insights again alongside the KPI.
Step 13: You can expand the KPI and its insight by clicking the “maximize” option for a better view.
Step 14: Once you close the current KPI, you’ll see all the titles of KPIs for which insights have been generated.
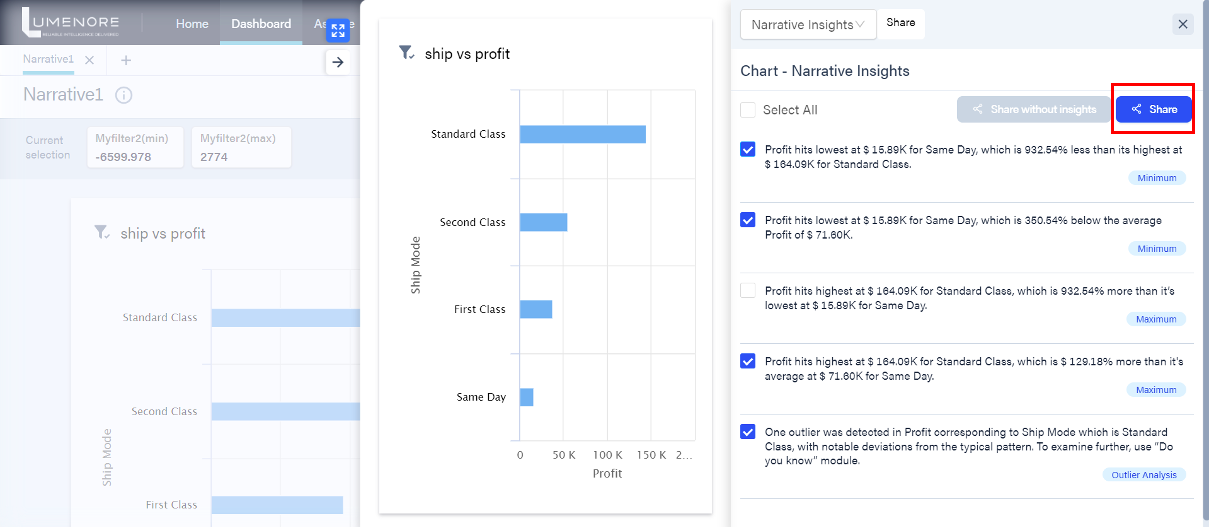
Step 15: You can share the insights and KPIs with your team after publishing the dashboard. Click on the “Share” icon, then select whether you want to share all or specific insights.
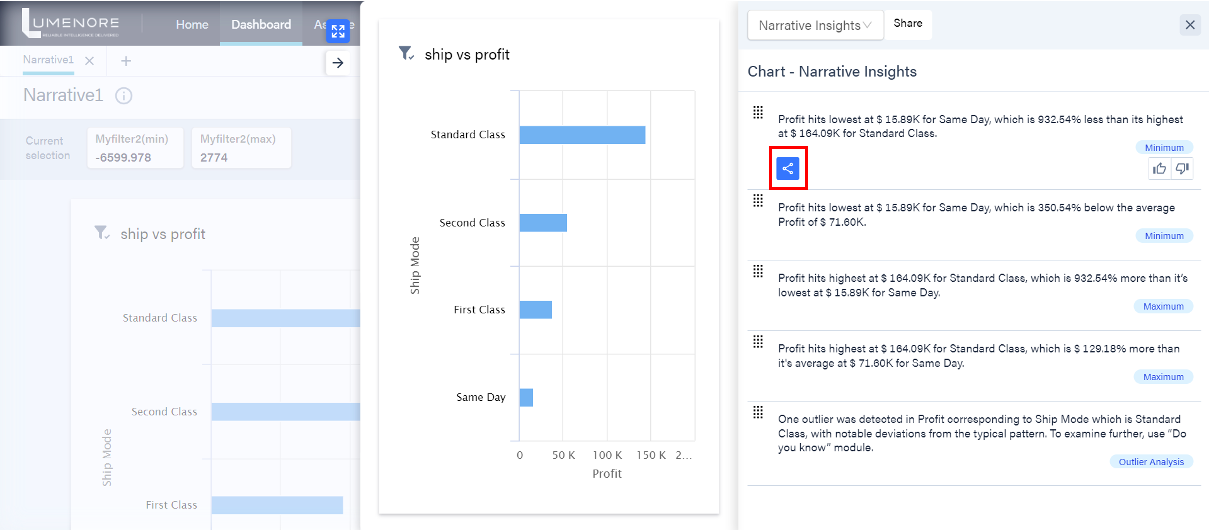
Step 16: Press “Share” after making your selections.
Step 17: You can add annotations as needed in the available space on the left.
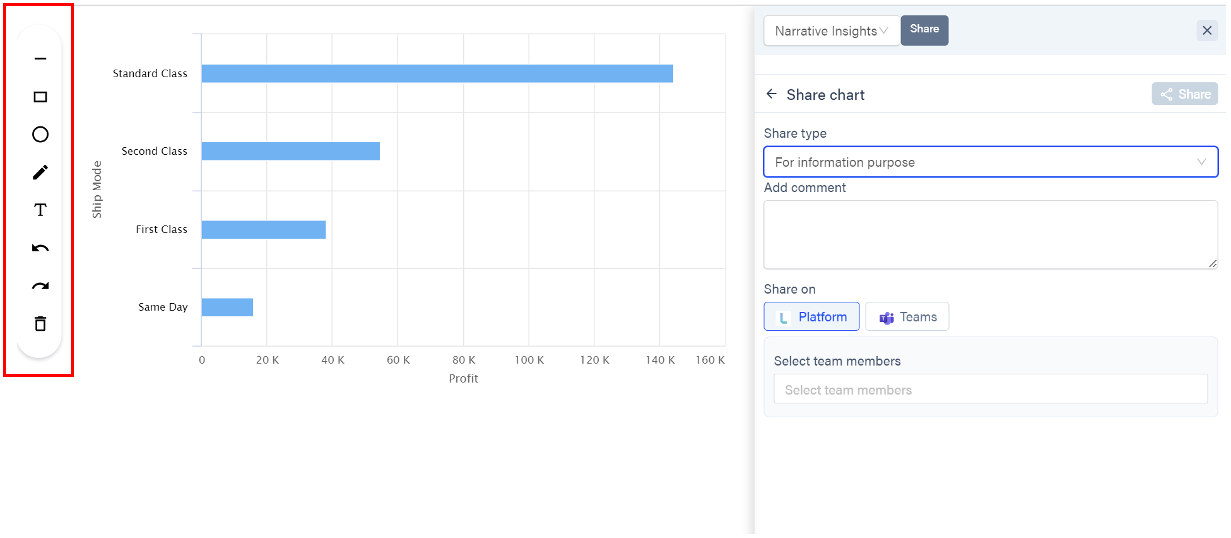
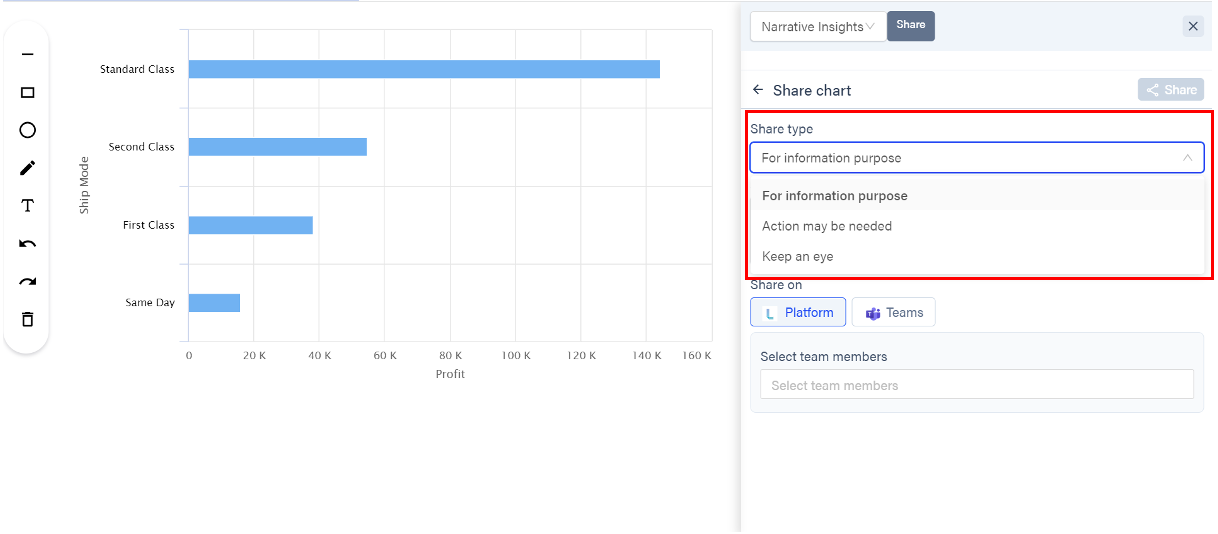
Step 18: Next, choose the type of sharing from the dropdown menu. Add comments if you have any in the “Add comment” section.
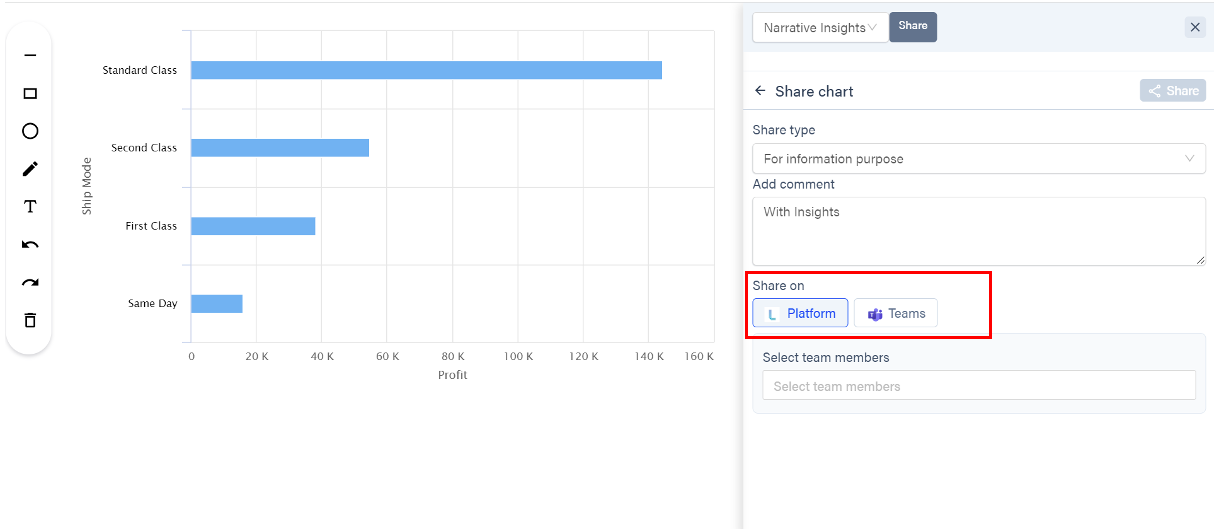
Step 19: You can share the KPI on the platform and Teams. If sharing on the platform, choose the names of the team members. If sharing on Teams, select the desired channel or add a new channel by providing the channel name and URL.
By following these simple steps, you can effortlessly generate and share narrative insights within Lumenore, enabling your team to make data-driven decisions with clarity and confidence.
Refine your Data Stories with Narrative Insights
Narrative insights transform how businesses interact with and derive value from their data.
This AI-powered feature helps users grasp the essence of their data by simplifying complex visualizations into concise, human-readable narratives, fostering a deeper understanding and enabling informed decisions.
Lumenore combines data analysis and natural language generation capabilities into a unified platform to enhance data strategies.
Our narrative insights feature not only explains the “what” and “why” but provides contextual information and explanatory narratives that shed light on the underlying reasons behind observed trends and patterns.
Take the first step towards harnessing your data’s full potential today. Book a demo with Lumenore and experience the power of narrative insights firsthand.
Alternatively, visit our website to learn more about how our innovative solutions can transform your data storytelling and drive better business outcomes.

About the Author

Content Creator @ Lumenore
Published: May 24, 2024